Note: new Speed and DP numbers are currently under development. The recent update has brought significant changes and horses will need to be rediscovered for racing 3.0. Use caution in the interim.
ZSIM - Zed Run Simulator
- Overview
- Simulator Model
- Racing Dashboard - Power Gap
- Simboard
- Breeding
- Simulator Accuracy
- Sample Size
- Speed
- Z-score
- Speed Vs. Variance
- Speed Vs. Finish Positions
- Paid Vs. Free
- Predicting ZED Flames
- Predicting ZED Flames - Addendum Stats
- ZED's Flame Simulator vs. ZSIM
- A Five Step Methodology for using ZSIM - Grading Your Horse
- Horse Analysis - Expected Value
- Technical Details
Overview
There are three key aspects of the ZSIM software, the horse profiler, race simulator, and the open races analyzer
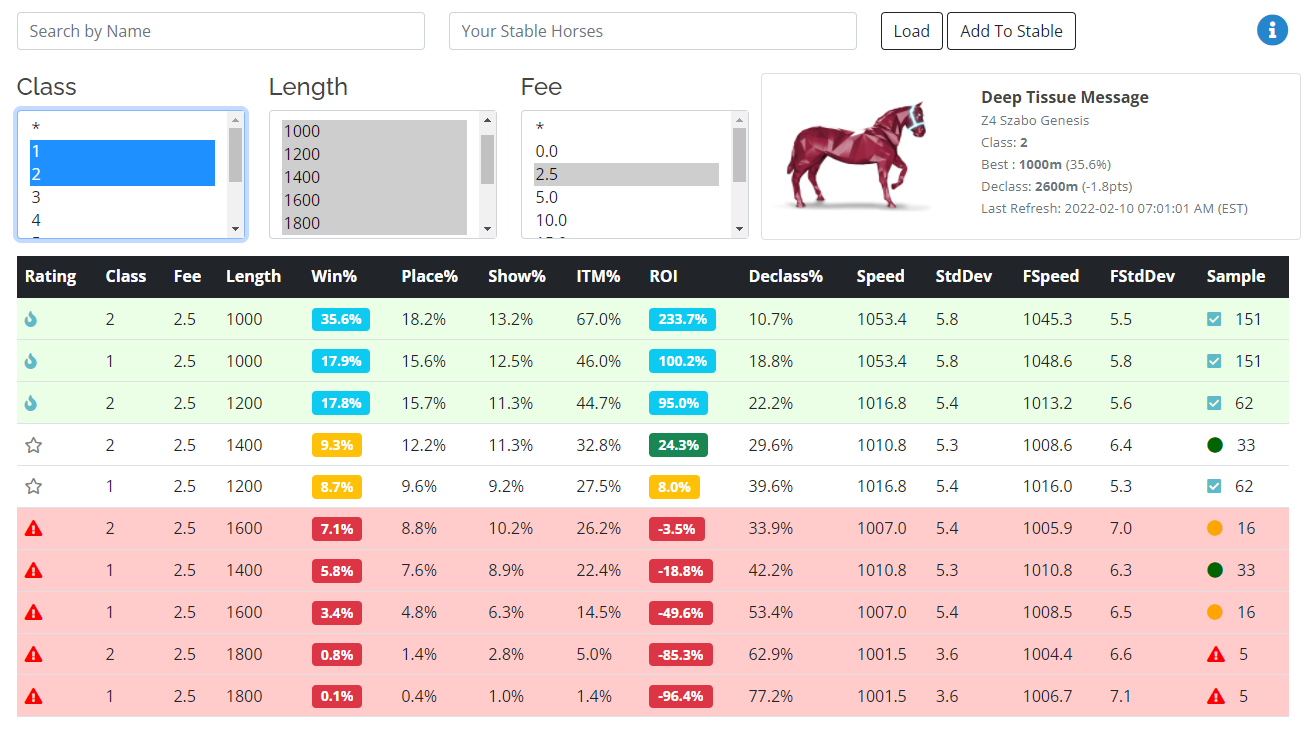
- Horse Profile - the profile provides a bird’s eye view of a given horse and outlines its expected performance at every class, distance, and fee level. Unlike stats that you may see on ZED.RUN or other secondary sites, the profile is NOT a compilation of your actual win loss records and profits. Rather, it is the product of hundreds of thousands of Monte Carlo simulations predicting how your horse would have performed if it had entered every race over the last two weeks.
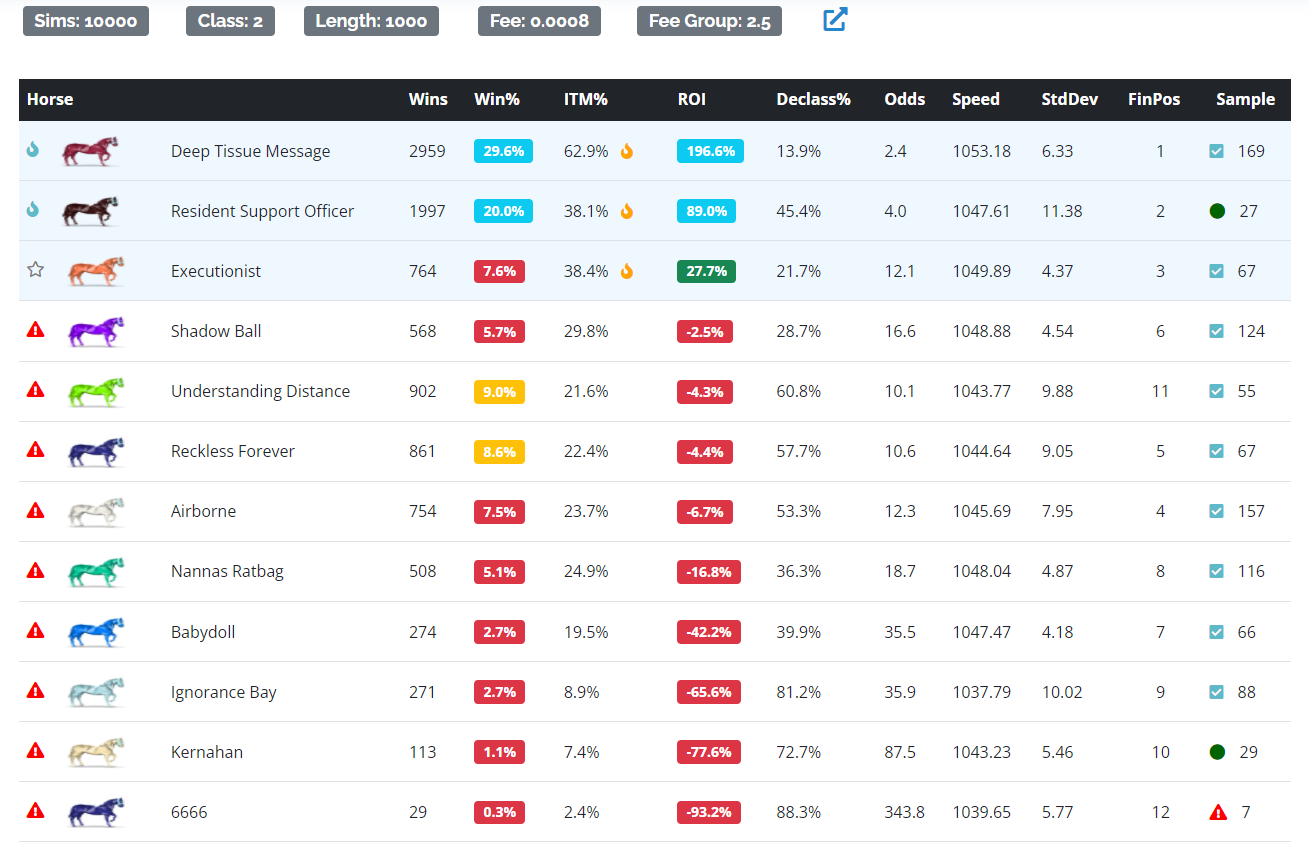
- Race Simulator - the simulator is like the profile, but the simulation results only considers the 11 other horses in each race. Because of this, you can get more nuanced predictions. For instance, if your profile predicts your ROI in C3 1000m $2.5 races to be +40%, there may be some specific races within this bucket where you may be predicted at 20% and others you may be predicted at 60%. The race simulator sorts this out at a race-to-race granularity, enabling you to perform better race selection.
- OpenRaces - the open races analyzer combines the profile and race simulator data to help you find open races on the ZED.RUN platform. ZSIM will import all open races and generate a race list along with each horse you may want to enter, based on your predicted ROI.
You can also run pre-race simulations of an open race, even if only 8 of 12 gates are filled, to choose the softest field.
Under the "Race" column, ZSIM provides a deep link directly to the race on ZED.RUN site, simplifying the registration process.
In order to use the open races feature, you must first add one or more horses to your stable from the profiles page. You may also edit which horses are active or limit the distances returned by managing your horses in the stable. By default, the open races are limited to paid races where you are projected to have a postive ROI. You can change this by toggling the Paid and +ROI switches.
The projected win% and ROI is based on your overall profile for the race type (class, length, and fee group). However, you can can get more granular results by clicking the RUN link under the Sim column to generate a race specific simulation. You may find that a particular race is softer or stronger than your overall profile prediction, helping race selection.
Note, if you simulate a race that only has 8 gates filled, ZSIM will supply three other filler horses + your profile horse to get to 12. The filler horses are denoted by a *** before their name. These are randomly selected from a pool of horses that have raced at the same distance, class, and fee level within the past 14 days. The more races a horse has in these race types the more likely it is to be selected as a filler.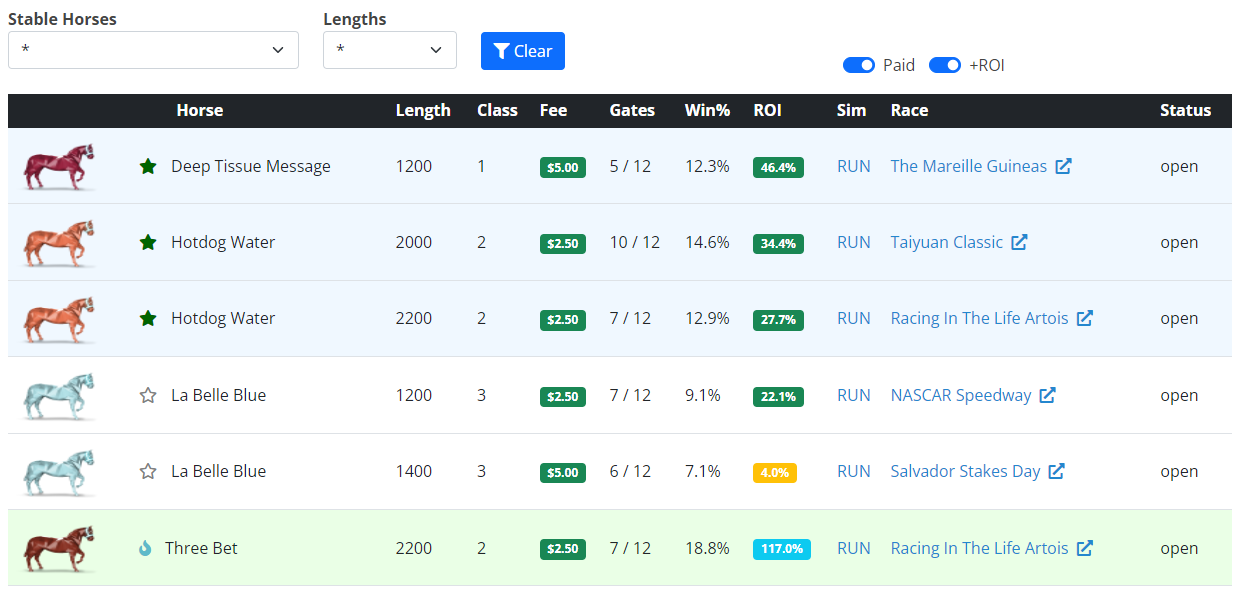
Racing Dashboard - Power Gap
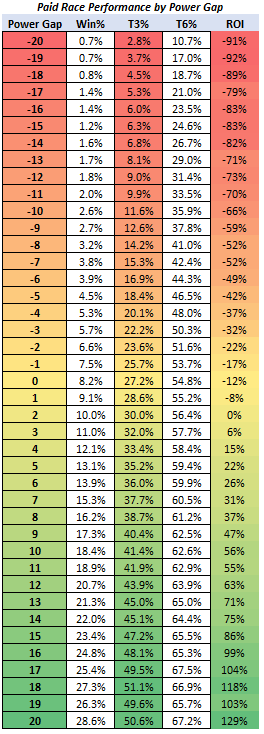
The power gap rating, located in the center of the racing dashboard, helps you guage the strength of the competition already registered for a race without running a simulation. The default win% and ROI are based on your profile metrics, which are derived from a two week simulation for all races of that type. However, individual races can vary in strength above or below this, so you either need to run a simulation or use the power gap as a quick reference. Note, the power gap should be highly correlated to the simulations, but it can vary based on race context and speed/variance ratios. For example, mega variance horses may have high power but not perform as well in certain race types, which the simulations will highlight.
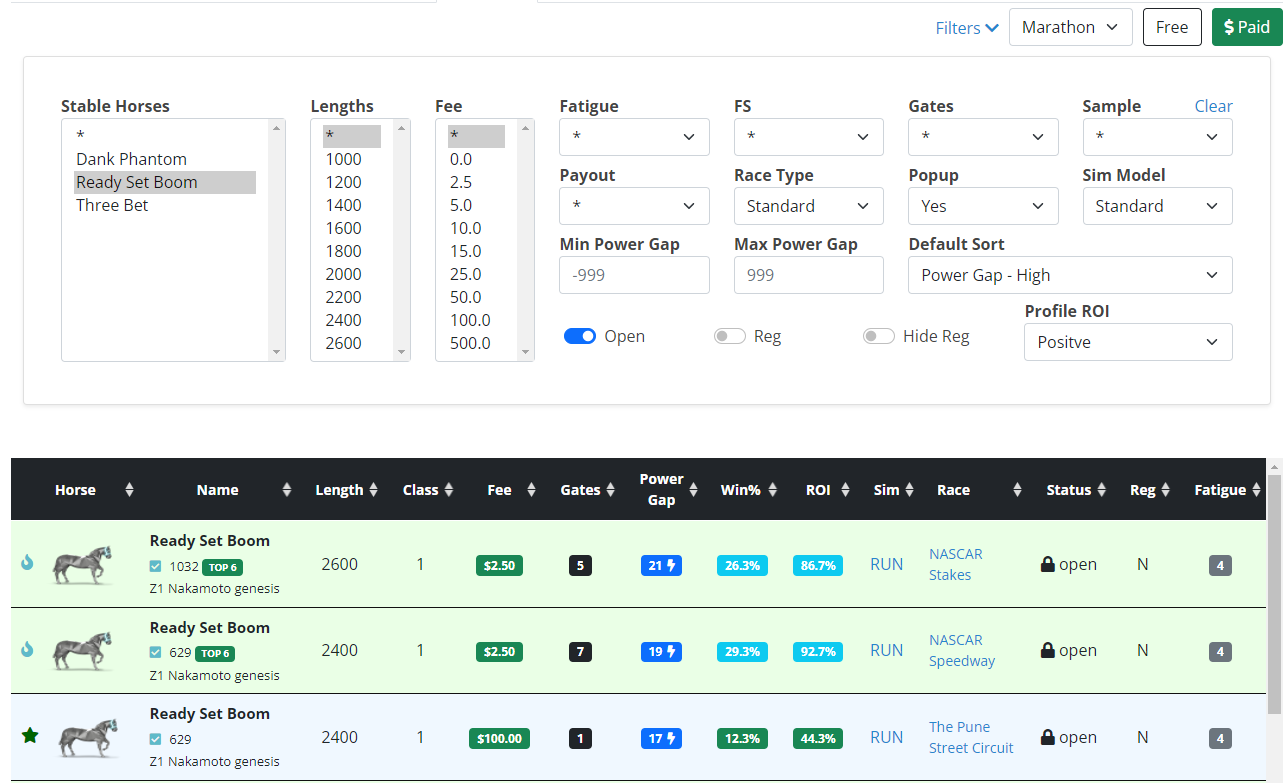
You may also set a min and max value for the power gap rating. For instance, a gap between -99 and -20 would target your best downclassing races. Additionally, if you set your Profile ROI to "All", you could sort your potential plays by power gap to find softer fields that typically would be negative ROI. See below for how horses have performed in paid races, based on their power gap.
Simulator Model
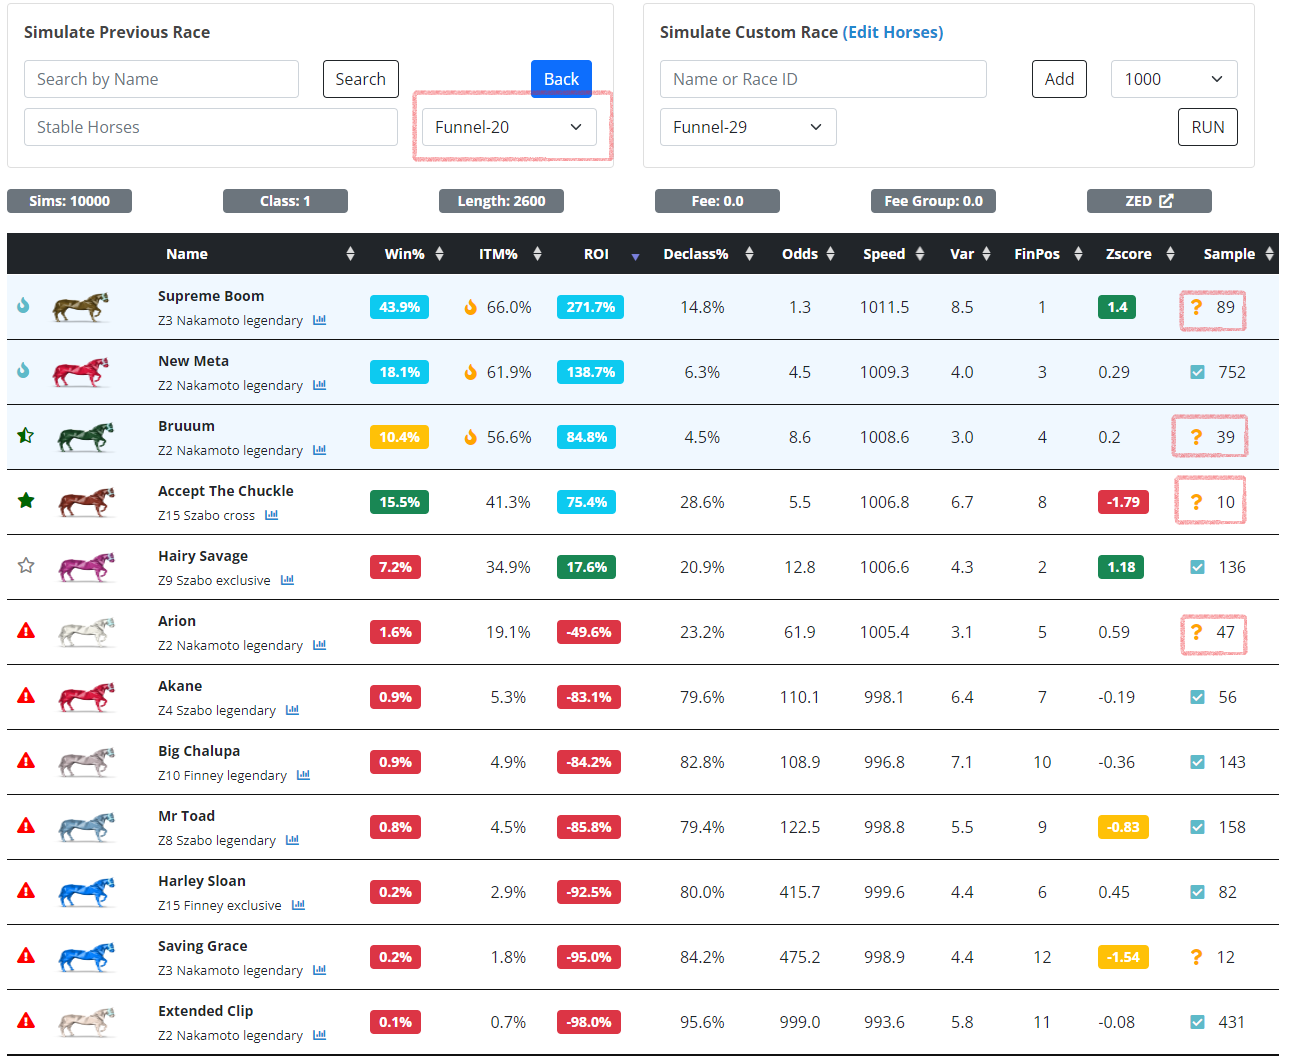
While running race simulations, either in the Racing or Simulator pages, you will see a Sim Model drop down containing options for Standard, Funnel-10, Funnel-20, or Funnel-29. The standard model will run the simulation based on the horse's speed and variance for the exact distance of the race being simmed. However, in some cases you may want to use the horse's funnel metrics, usually when they have a lower sample size. Funnel-10 tells the simulator to use the funnel speed and variance when the horse in question has 10 or less races at the specific distance. Likewise, Funnel-20 and Funnel-29 means the simulation will use the funnel speed and variance if the horse's sample size is at or below 20 and 29 respectively. In the example below, Supreme Boom only had 8 races at 2600m, so when setting the model to Funnel-20, it merged in its normalized speed at 2200 and 2400 to improve its total sample to 89. The orange ? denotes that the particular horse's sample is based on the funnel and not the exact distance.
Simboard
The Simboard is an all-in-one tool for ranking horses by their simulated stats, speed, variance, distance speed buff/nerf (DS+ or DP), and power rating. For each
factor, a horse is given a percentile ranking against the global field (or, optionally, only those horses that have entered paid races in the past 60 days). You can bounce these
horses against the Hawku Marketplace to see which horses are for sale, compare traits with other horses for breeding purposes,
or just study to better understand what types of horses are winning under a variety of conditions.
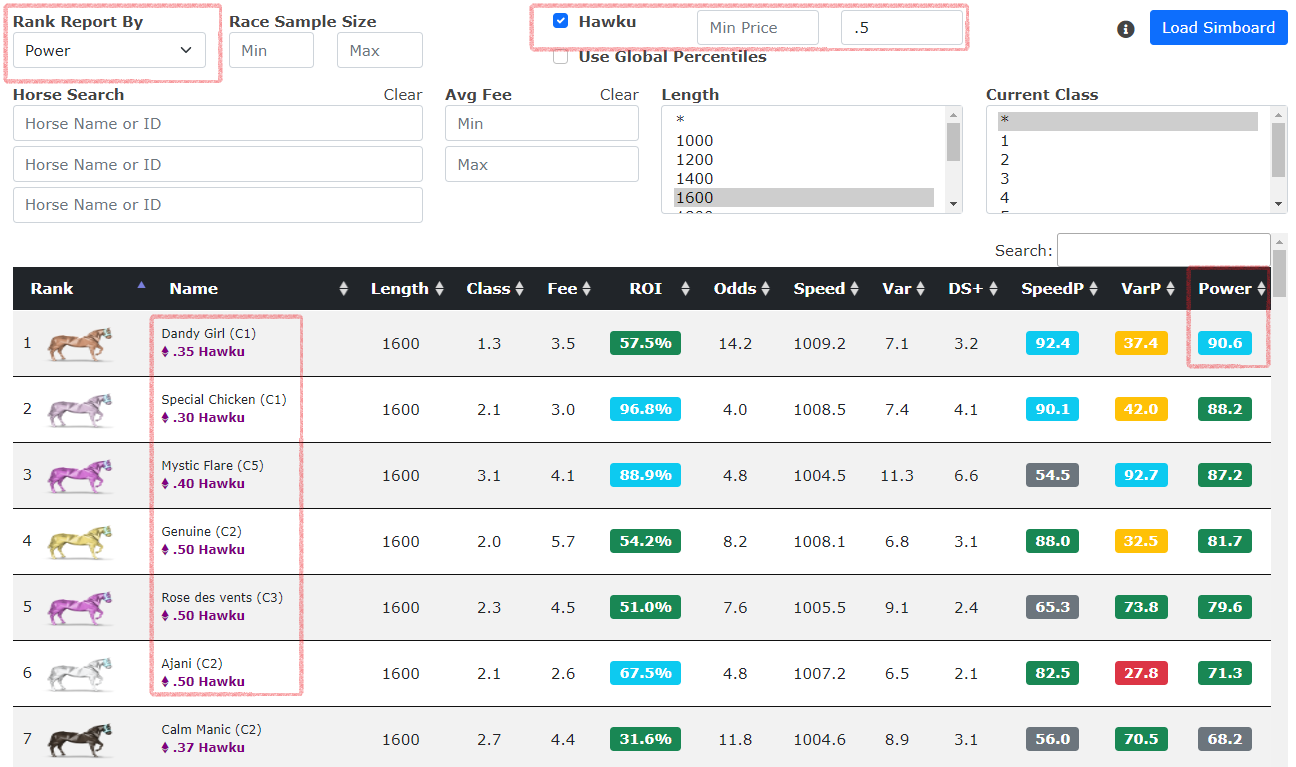
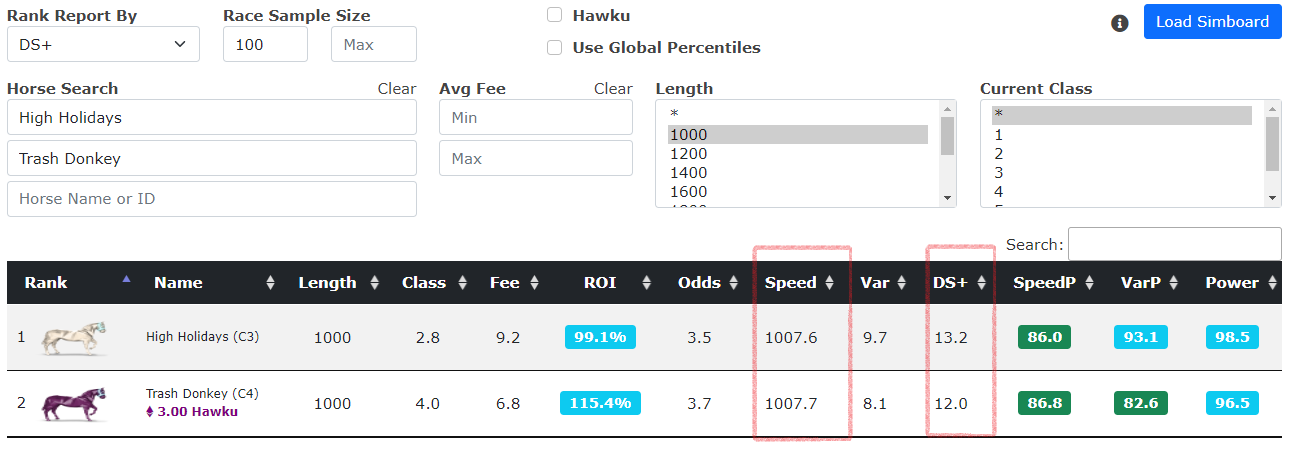
As shown below, you can build a report ranking horses by their Power percentile (a compound factor of speed and variance, one of the most predictive stand alone factors you can use), but then
limit the report to only those horses that are for sale on the Hawku Marketplace, under a set price range. The horses for sale will have the purple ETH link below the horse's name.
Breeding
The breeding page allows you to enter two hypothetical parents to simulate what type of offspring they could produce, under any range of probabilities. Additionally, you will get a comps report to view horses with approximately the same speed and variance, which allows you to get an idea of what class/fee they are competitive in
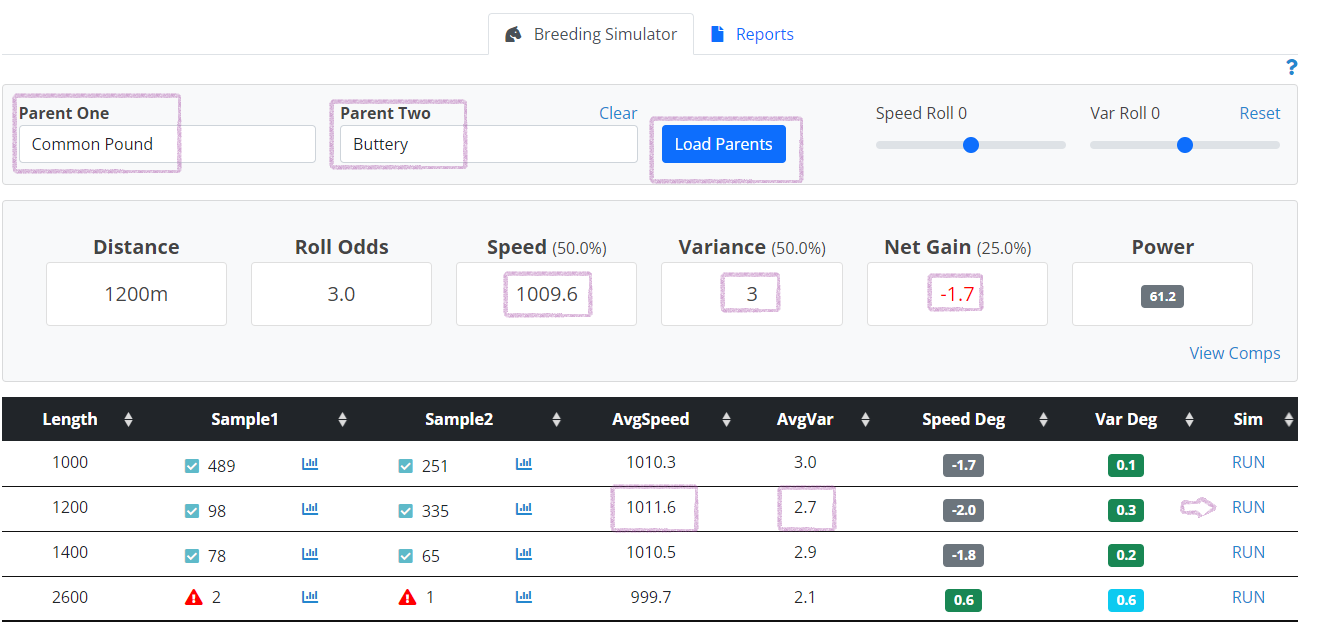
As shown above, to simulate breeding Common Pound and Buttery, enter their names and click Load Parents. You will see a chart with their average speeds and variance for each distance. Select the distance you are most interested in simulating and click the RUN link (in this example, 1200m). You will then see a projected foal above, complete with Roll Odds (the probability of getting this exact foal or better, expressed as an odds line), projected speed and variance, and the net gain (or degredation) from the parents, which is how many net power points (speed + var) it gained. Interpreting the above, this is saying you have a 3/1 shot (25%) of getting a foal with 1009.6 speed (or better) and 3 variance (or better), which would result in a foal with -1.7 net speed/var points behind its parent's average.
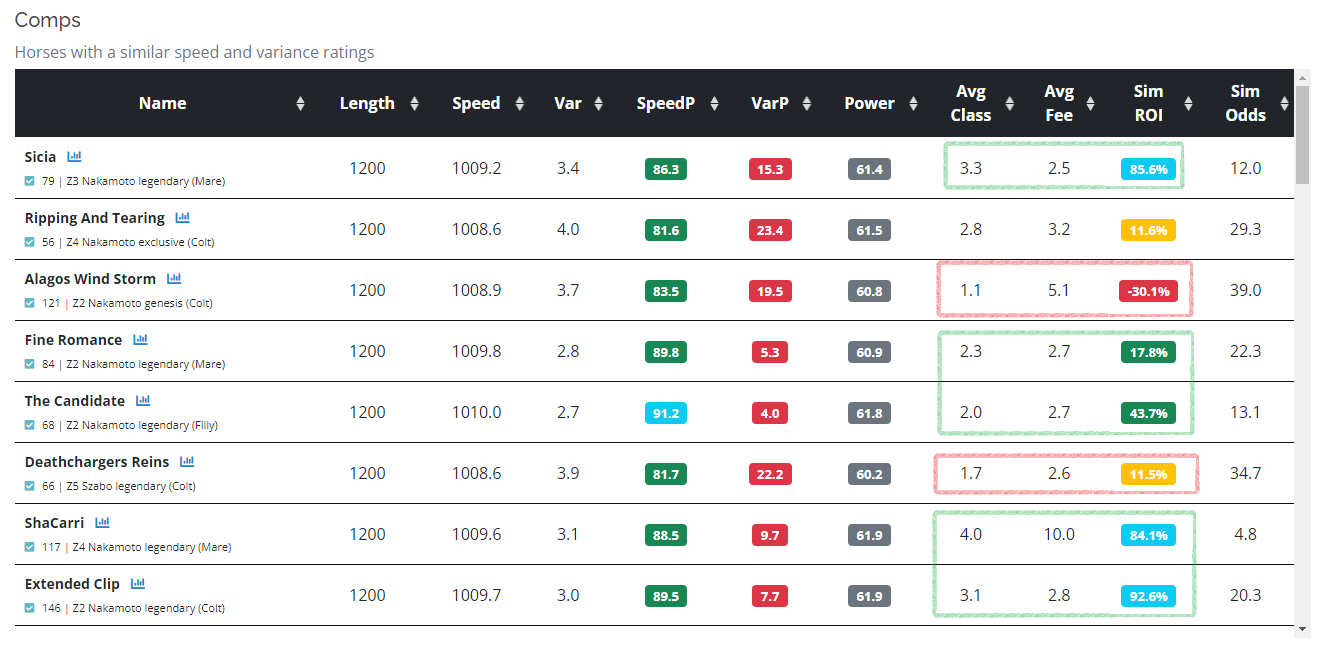
After reviewing the simulated output, you may also click the View Comps link to get a report of similar horses. To date, this is what the comps report looks like for Common Pound and Buttery with the default 3 to 1 roll. It's helpful to sort on average class and fee, as you can easily detect how performance changes with competition level. Looking at the below, you can see the simulated foal may do well in class 3-5, C2 at lower fees, but it will start to struggle in C1.
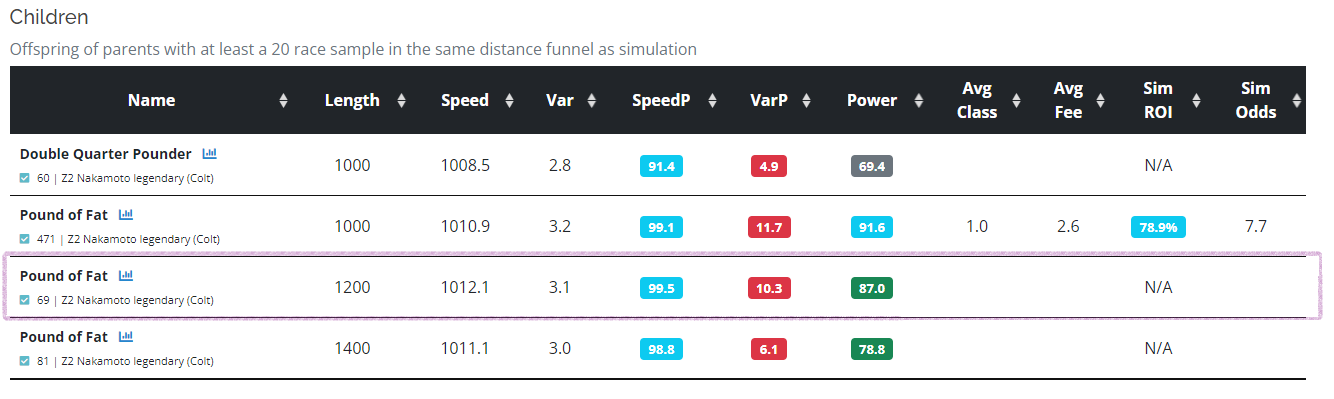
This parent combination actually did have a foal, named Pound of Fat, and you can see its actual speed and var numbers (to date) are 1012.1 and 3.1 at 1200m.
The foal was actually better than the default/minimum prediction at 3/1 odds, which introduces the concept of speed and variance rolls. To reverse engineer the type of rolls this foal actually got, you can adjust the speed and variance sliders, as shown below. To end up with a 1012.1 speed and 3.1 variance, the speed roll was actually 1.25 (this is 1.25 standard deviations on the bell curve, from a probability standpoint) and .1 for variance. The net gain was actually a positive .9 points, which was just about 2.6 points better than the default roll. However, you can see how much the odds of this happening has changed, as it's now a 19.6 to 1 shot (4.9% chance), which demonstrates how difficult it is for a foal to match or exceed its parents (more on this below).
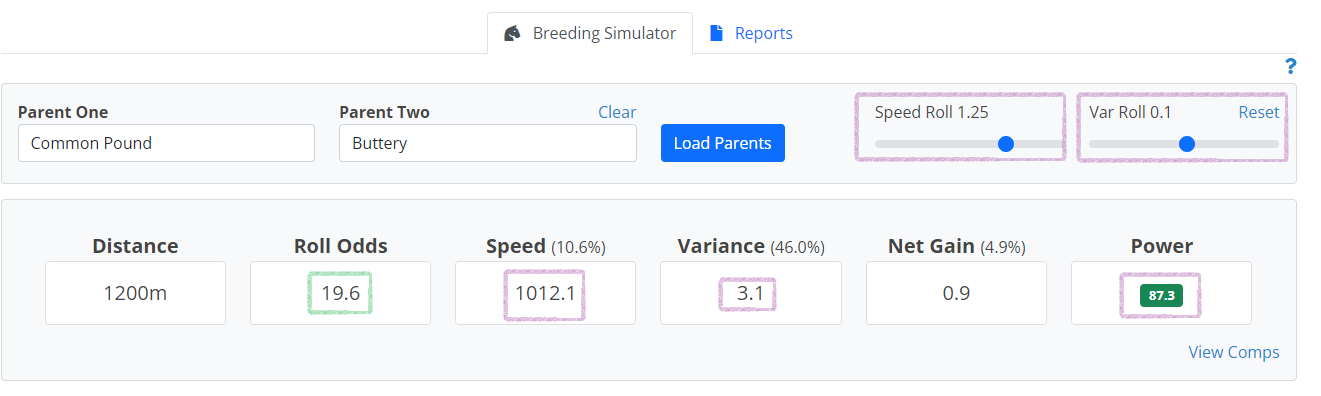
One of the principles supported by the breeding data is that speed and variance get separate rolls, which is why there are two sliders. You can also see percentages next to speed and variance, for example, which represents the probability of getting the roll just for speed (7.1% chance) and just for variance (27.4%), which when combined results in a net chance of 1.9% (or 50.5 to 1). Depending on how you adjust the sliders it can result in wildly different probabilities. Note, any time you change the sliders you need to click the RUN link for the distance again.
Breeding Principles
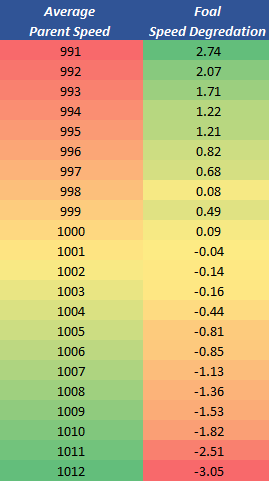
An important principle to understand (which is represented in the logic behind the speed and variance rolls of the simulator), is that the strength of the parents combined has a direct correlation to the probility that your foal will be as good as or better than the parents. Using speed as an example, here's how distance speed passes down to the foal on average, based on the speed of the parents. There's a clear pattern that the weaker your parents are the more likely it is that you get a buff, while the stronger your parent average is, the more it will get a nerf. If you will recall the original simulation above, you may have noticed for 1200m a column called "Speed Deg", and it read -3.05. This is based on the logic of the chart below. 1012 (rounded) is an exceptionally fast parent average. If you produce a foal under these parameters you have to "make up" -3.05 points, on average, which means you need a much better roll. Granted, you don't always need to match your parents to have a competive racer, but its an important distinction to understand. It can be signficantly more expensive to breed top end parents and you don't always get what you pay for (in fact, you might say you rarely do). Although the distributions are different, variance follows a similar pattern. The more variance you have, the less likely it is that you pass it all down.
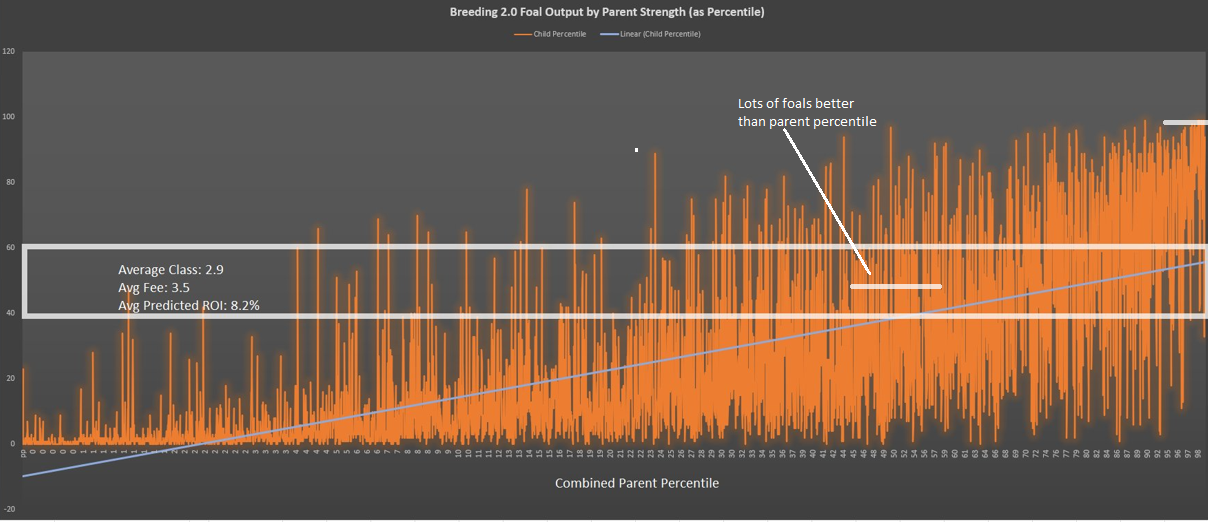
Another way to illustrate what's happening in breeding 2.0 is to chart the foals by their strength, expressed as a percentile (0 to 100 in the left Y-axis) against the strength of the parents, expressed as a percentile (0-100 in the x-axis). You can see in the very bottom right of the chart the number 98, which represents those parents where their combined average would have them ranked in the 98-100th percentile against paid racers. The best of the best. The orange lines above it represent all the foals they produced and where they rank by percentile. As you can see, virtually all of the foals are "worse" than their parents (doesn't mean they are bad), but also note that there are a lot of foals that are significantly worse. In fact, that median band through the middle (foals that fell between the 40th and 60th percentile) shares a lot of output with parents that ranked in the 50th percentile. Additionally, horses that ranked in the 50th percentile have a good portion of their foals not only better than them, but starting to knock on the door of the 90th+ percentile parents on occasion.
Conclusion: breeding 2.0 is still early, and as stated above, this is based on the samples we have to date and it is not trying to suss out ancestor or breeding talent yet. With that said, these patterns have held as the samples become larger, so I don't expect the big picture to change. As of today, here are the twelve approximate principles I see:
- So called “breeding rolls” are normally distributed. If the average degradation of speed from parents to foal is close to 0, this is an average, or the middle point of the bell curve. Half the foals will have degradation and the other half will see improvements.
- If you breed with a horse that is dominate in 1000m and another that excels at 1400m, it's possible your foal is dominate in neither distance and excels most at the blended distance (1200m).
- The stronger your parents are, the more ZED nerfs the breed algo. Meaning, you need a much less probable roll to overcome the nerf just to match your parents. .
- The weaker your parents are, the more ZED buffs the breed. Meaning, it’s much more likely you produce equal or better foals, even with an average roll. .
- If you are breeding with elite parents (think 99th percentile), there’s only a 3.67% chance you will produce foals equal or better than the parent average. .
- If you are breeding donkeys, there’s a 46% chance the foal will be better than or equal to the parent average. .
- If you are somewhere in the middle between donkey and elite, you have about a 25% chance of producing a foal better than or equal to the parent average. .
- Speed passes down with less degradation than variance, it’s close to 0 on average. .
- Variance pass down gets its own roll, independent of the speed roll. .
- The higher the parent variance, the more ZED nerfs the var pass down. Meaning, if you have around 90th percentile variance, there’s only a 2.3% chance you pass it all down. If you have average parent variance, you have closer to a 25% chance that it all passes. .
- Does this mean you should not breed high variance horses? Not necessarily. High variance horses usually have lower speed. Lower speed horses get a breeding buff, which counter acts the variance nerf. .
- When measuring “net” degradation, the ratio of speed and variance passed down, 75% of all horses will be worse than their parents. .
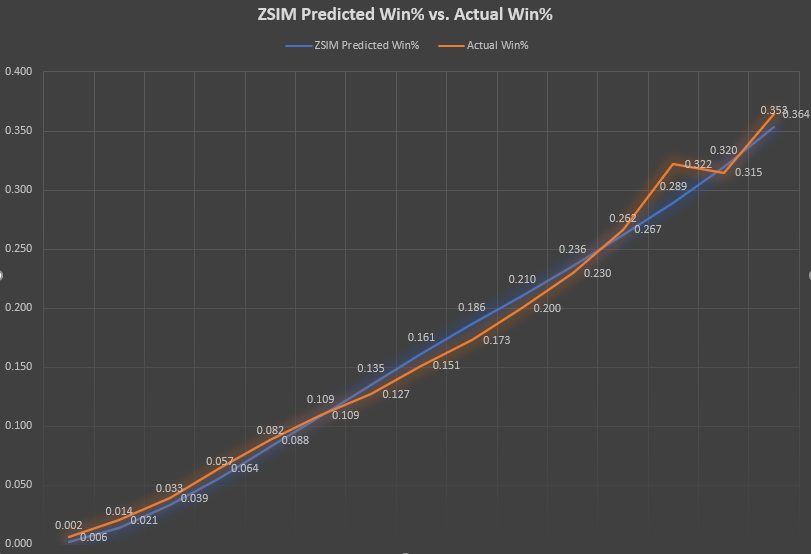
Simulator Accuracy
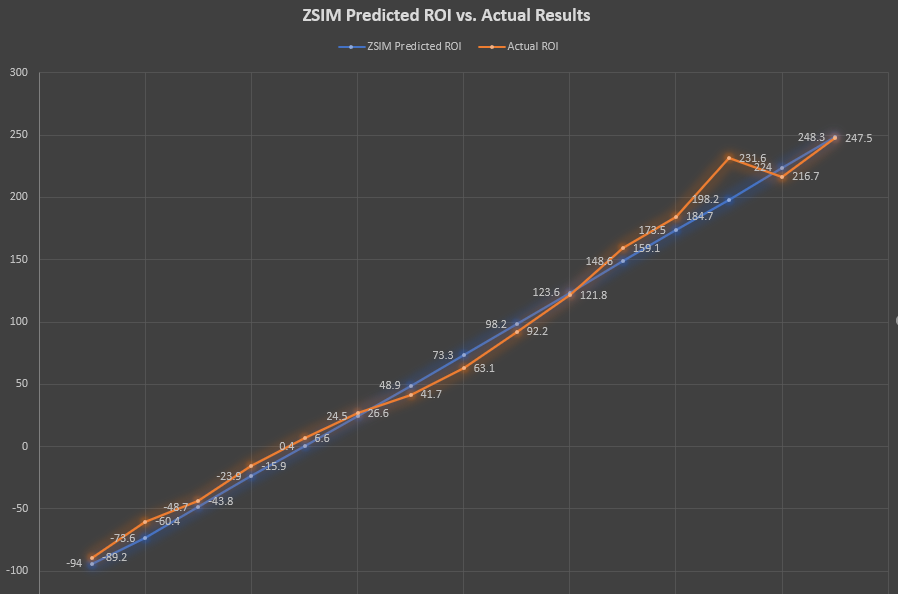
When analyzing over 30,000 paid races between 1/18/2022 and 2/13/2022, and over 200,000 race entries, these charts illustrate the ZSIM pre-race simulation ROI and win% predictions against how the horses actually performed. These races came from all fee levels, classes, and horses with at least a 30 race sample size at a given length.To simplify the data, the predicted and actual ROI were averaged and placed in an ROI group, rounded to the nearest whole 25%. These are the Y-axis labels, ranging from -100% to +250%. So for example, horses that rounded closest to a -100% predicted ROI had an overall average predicted ROI of -94%. The actual average ROI for horses in this group was -89.2%. Likewise, if you jump up to the +150% group, ZSIM had an average predicted ROI of 148.6%, while the actual ROI averaged to +159.1%
Sample Size
Sample size is a critical component to pay attention to when using ZSIM. Below we'll discuss what it means and how to best think about it. First, let's lay out some general rules of thumb for the ZSIM sample icons in terms of confidence:
- Bad (less than a 10 race sample)
- Low (sample score: 0-32%)
- Caution (sample score: 33-49%)
- Average (sample score: 50-66%)
- Good (sample score: 67-84%)
- Great (sample score: 85-100%)
Confidence here means the chances that your performance after X races will represent your long term average. However, this is more of a pragmatic confidence, not a certainty. To view your sample size score, you
can hover over any icon in the profile, simboard, or other related reports. The closer it is to 100% the better.
Also note, these icons are dynamic for each horse and derived by computing your horse's standard error for their given distance sample size and variance. The higher your variance the larger the sample needed to have the same
confidence as a lower variance horse. Each distance is calculated independently, so the standard error calculation is used as a starting guide. You can better predict if your error range is likely to go up or down based on flames, alignment/trending with other funnel distances, and expected ranges from parents or bloodlines. More on this below.
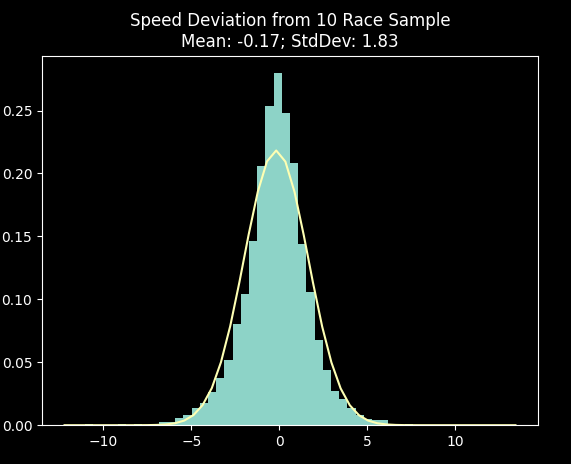
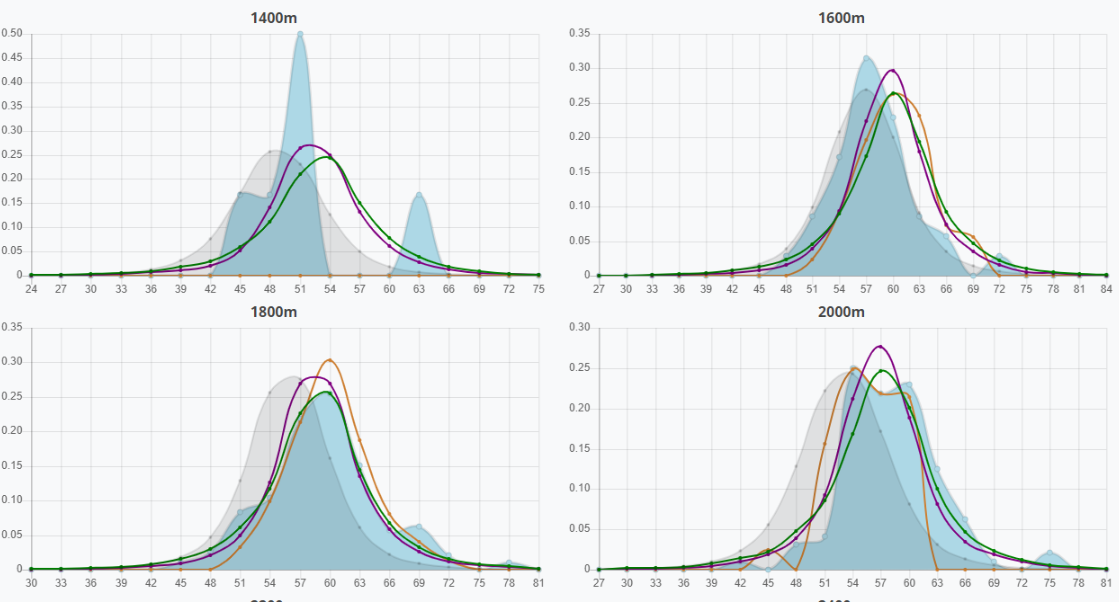
The chart below measures what happens when you compare a horse's average speed, after its first ten races,
to its long term speed (say, after 100+ races). As you can see, the mean is really close to zero, so that means about 50% of the horses improve on their ten race sample,
while 50% end up worse. The standard deviation is 1.83, so this means that you should end up within +/- 1.83 speed points around 68% of the time on a normal distribution.
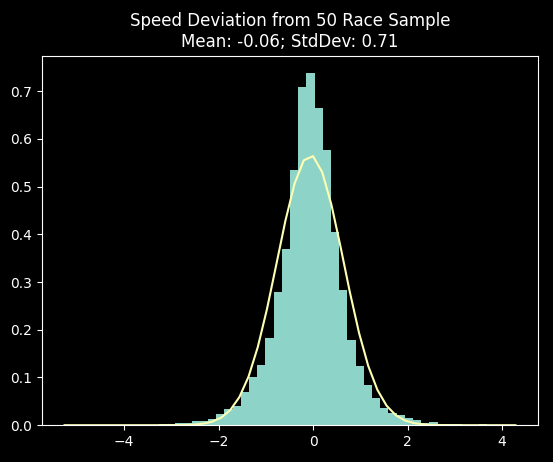
Now compare this to what happens when you bump up your 10 race sample to 50 races vs. the horse's long term average. You can see the average gets even closer to zero, and the deviation from the long term mean drops by more than 60% (1.83 down to .71).
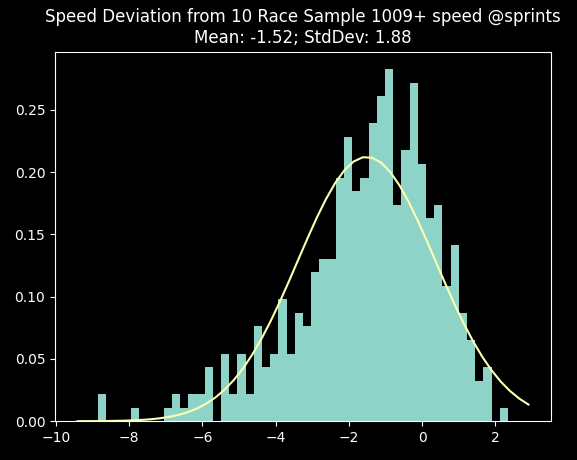
The tricky part to this is understanding that these deviation rates are overall averages. The error rate is much higher if your horse is performing well above expectation. Meaning, if you have a ten race sample where your average speed is 1013 at 1000m, this is the same speed as Billions, the fastest base sprinter in the game. This functions as a ceiling, so it's much more likely your average speed is going to regress back to the mean, without taking anything else into consideration. To illustrate this, here's sprint races where horses had a ten race speed sample of 1009+. As you can see, the distribution starts to move negative because of the 1013 ceiling, and the vast majority of the horses do not maintain their speed.
A few notes in summary:
- The data shows that your ten race speed can still be very predictive. For example, when ZSIM predicts a horse to finish ITM, and it only has a 10-15 race sample, the predictions are still spot on, overall.
- As the charts above show, most of the error comes when your horse has a ten race sample and the speed is well above expectation (from a global average perspective).
- With this in mind, the main takeaway is not just that 10 race samples are inaccurate across the board; it's that they can be very inaccurate when the horse in question ran multiple top end races within the small sample, skewing the results until more races normalize it.
- Also note that when I say a horse is above expectation, it's a generic global perspective. This is where some of your additional analysis can be added onto the horse's speed and sample size. For instance, is it running above expectation but also flaming against other strong horses? Are the parents really strong, so the speed of the foal makes more sense, vs. the foal of some donkeys that just got a few mega rolls in their races?
- There's also some confirmation bias with sample sizes. For example, most horses don't end up with 99th percentile mean speeds after 10-15 races. However, when they do occur, they stick out like a sore thumb, and we tend to give all small samples a bad wrap for accuracy. Meaning, there's tons of horses that run right around their averages after ten races, they usually aren't very good, and we don't tend to give equal credit to those cases.
- Although not covered in the charts above, another red flag for small sample sizes is when your variance rating is really high (think 8+, though it can depend). Because a high variance horse will naturally run more races in the extremes, the samples required to balance some of these can be much higher.
- Every small sample horse has the same issue, so there's a counter balancing of errors. This is why, I think, the predictions are still very close. You are really right in some races, and maybe really wrong in others, which averages out over the long run. You just need to measure your financial risk tolerance accordingly and avoid the obvious outliers.
The chart below outlines how the predicted ROI can waiver from the actual, based on sample sizing buckets. The race entries below were from all paid races, at all class levels and distances, if they had a predicted ROI of 0% (break even) or better. So for example, horses that had a sample size of 11-20 at the time the race was run, and pre-race ZSIM predicted the horse to be 0% ROI or better, the 12,680 entries had an average predicted ROI of 53.3%. When calculating the acutal ROI of the same horses for the same races, it was 24.8%. ZSIM over predicted their chances, although significantly it was still close enough to keep the ROI in the black.
| Sample Size | Total Race Entries | ZSIM Avg Predicted ROI | Avg Actual ROI | ZSIM Avg Predicted Win% | Avg Actual Win% |
|---|---|---|---|---|---|
| 1-10 | 9,829 | 45.2% | 10.8% | 12.7% | 9.9% |
| 11-20 | 12,680 | 53.3% | 24.8% | 13.8% | 10.3% |
| 21-50 | 29,936 | 47.3% | 35.7% | 13.3% | 11.8% |
| 51-100 | 36,355 | 46.1% | 43.2% | 13.2% | 12.7% |
| 100 + | 74,816 | 42.3% | 42.6% | 13.1% | 13.2% |
A few notes on sample sizing
- On a broad average, ZSIM will still produce a postive ROI on horses with a low sample size, but you should do some outside confirmation before digging too low.
- Note the linear trend towards almost perfect correlation between the predicted and actual ROI and win% as the sample size grows
- Note that the table above is only looking at race entries with a predicted break even or postive ROI. This is why the number of race entries goes up significantly as the sample size grows. ZSIM understands that low race sample horses, as a category, rarely win, this is why it rarely pegs them as a postive ROI play. Only 6% of the 163,000 entries here had a sample of 1-10. However, if the table were reversed to only pull entries that had a negative ROI prediction, about 33% of the total population would fall in the 1-10 sample group.
Below is the same table, but it includes all entries regardless of their pre-race ZSIM prediction:
| Sample Size | Total Race Entries | ZSIM Avg Predicted ROI | Avg Actual ROI | ZSIM Avg Predicted Win% | Avg Actual Win% |
|---|---|---|---|---|---|
| 1-10 | 64,916 | -38.4% | -37.3% | 4.4% | 4.9% |
| 11-20 | 34,621 | -14.0% | -20.0% | 7.0% | 6.2% |
| 21-50 | 63,105 | -1.9% | -4.2% | 8.3% | 8.0% |
| 51-100 | 60,827 | 12.3% | 15.1% | 9.8% | 9.7% |
| 100 + | 107,152 | 20.9% | 23.3% | 10.9% | 11.2% |
Speed
ZSIM likes to express its speed figures (finish times) as meters per minute (MPM). For example, if a horse ran 1000m in 57 seconds flat, their MPM would be: 1000 / 57 * 60 = 1052.6 MPM. This is just a matter of preference or custom, but it helps me visualize what the times actually mean. For instance, if a horse runs 1050 MPM and another runs 1053 MPM , after one minute the faster horse will be 3 meters ahead (about one digital horse length?).
You'll notice, however, that the ZSIM speed doesn't always align with the raw finish times. This is because ZSIM adjusts the final times of a race to account for the "ZED Variant", based on the specific horses in the race. ZED likes to add a secondary layer of speed (or negative speed) to its races that doesn't align with normal standard deviation expectations. The best way to think about it, in my opinion, is that there are two facets to every race. First, how fast each particular horse will run, which will be between -3 and +3 standard deviations of their average speed, about 99% of the time. And then there is the race variant ZED injects, which causes everyone in the race to run an additional -3 to +3 standard deviations.
This causes some wild finish times if the ZED variant is +3 SD and a horse also runs a +3 SD, making its actual finish time +6. This is so statistically improbable that it should never happen in practice. Likewise, if the ZED variant is -3 SD and a horse runs +3 SD, the final time of the horse will be pedestrian, right at the average. The key is to adjust for the ZED Variant as much as possible so that we understand the horse's true speed ability. In the examples above, it's critical to not have a +6 SD skewing a horses speed faster than it really is, especially if they have a small sample size. Likewise, we'd vastly underestimate a horse's speed if we treated their +3 SD race as +0 SD.
Z-score
A Z-score helps you understand how far above or below the mean a given data point is, measured in standard deviations (SD). In terms of ZSIM, the data point we are concerned about is the speed of a single race and how that relates to the horses' average speed for all races at the same distance. For example, if your average speed at 1000m is 1050 meters per minute (MPM) and your standard deviation is 5 MPM, a race speed of 1055 means that your z-score would be +1 (1050 + 1SD (5) = 1055).
Likewise, if the horse ran a 1045, it would have a Z-score of -1 (1050 - 1sd = 1045).
Generally, 99.7% of your speed times will fall within three standard deviations, plus or minus,
giving you a practical range of -3 to 3 (0 being the exact average). The further you get to one side of the range, the less probable
it is to occur. Note, the z-score is derived from the horse's final times, expressed in meters per minute, but these values are adjusted for race variance by ZSIM in advance.
There's not really anything predictive about the z-score, as it's something you would review after the fact.
However, it does help you understand the data and the final results. If a horse has a high
probability of winning a race, but ends up running a -2.5 z-score race, there's a really good chance it finishes 12th.
Likewise, for a really slow horse to win, based on its average, it means it may need to run a +2.5 SD race,
which has a pretty low probability of happening. If you hit a losing streak, there's a little bit of solace to be had by
checking to see if your z-score is consistently below 0. If so, maybe you are just riding out a cooler.
Or, if you ran a good +1.8 z-score race, but still got second, it may help to know that the first place horse had to
run a +2 z-score to beat you, and it's "unlucky" that you both get strong z-scores in the same race.
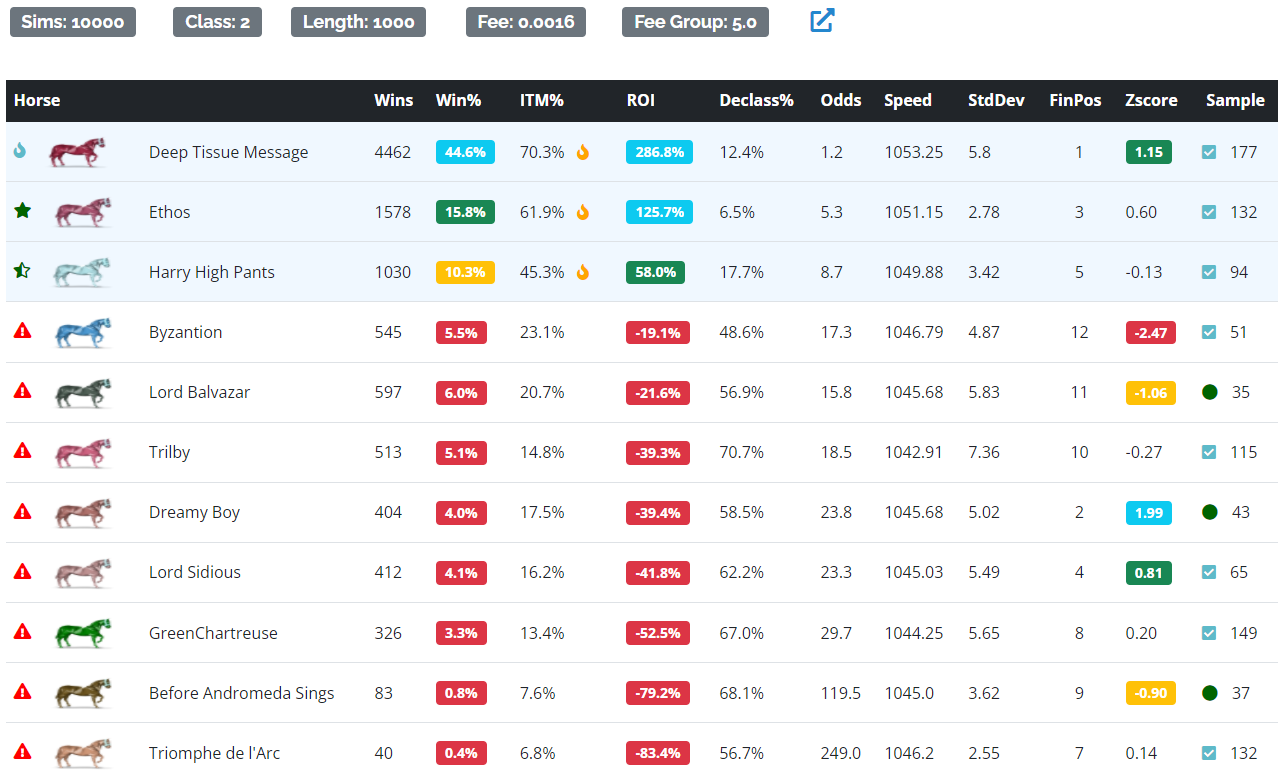
In the example above, you can see that Dreamy Boy is ranked 7th in ROI and only has a 4% chance of winning this race. However,
it ran a +1.99 z-score race (only about 2.5% of all races will ever have a z-score >= +2), which was fast enough to secure second. Unfortunately for Dreamy, Deep Tissue Message also had a strong +1.15 sd race, which on top of its stronger base speed, was too much for the 1.99 z-score to overcome.
Speed Vs. Variance
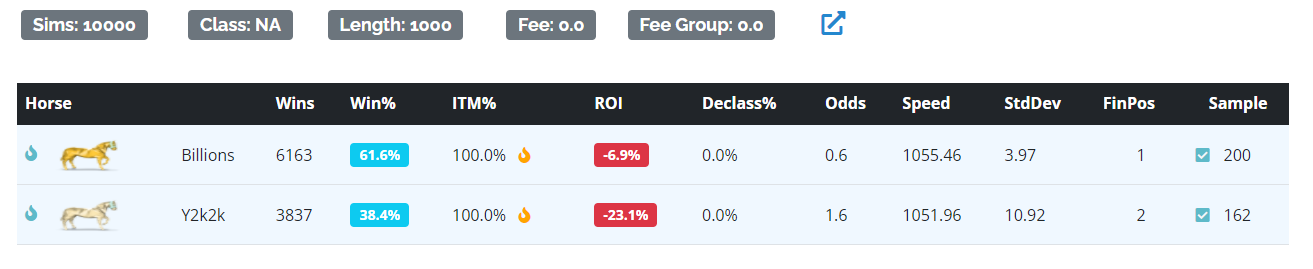
There’s an intricate dance that occurs when a high base speed horse competes against a lower speed horse with high variance. One way to illustrate what happens is to use the custom race simulator. Below is a 1v1 matchup of Billions, our high base speed low variance horse, against Y2K2K, our low base speed horse (relative to Billions) with high variance. You can see that Billions has a decided advantage in the win column, wining 61.6% of the 10,000 simulated races, while Y2k2k gets the other 38.4% of them. Roughly, Billions has a 1.6 to 1 advantage.
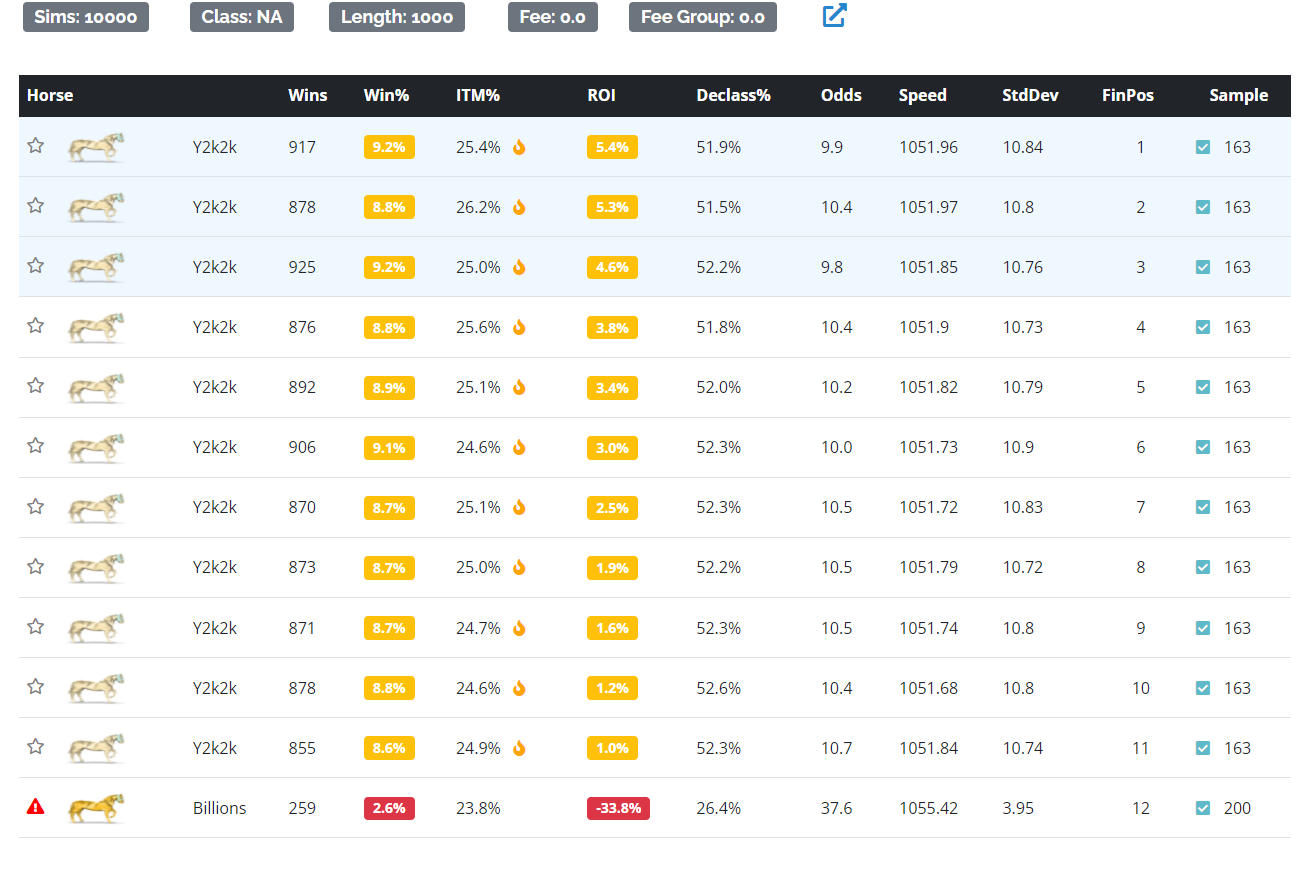
For illustration purposes, we can create an extreme example where we clone Y2k2k 11 times and run them all against Billions in the same race. As expected, the win rates for each horse goes down a lot just from the sheer number of runners; but significantly, Billions doesn’t have a win% advantage over a single clone of Y2k2k. He could only win 2.6% of the 10,000 races in this context, while the 11th ranked Y2k2k clone won at 8.6%.
What’s happening here goes back to z-scores. When both Billions and Y2k2k run +1 z-score race, Y2k2k will win
every time because the variance boost is so high it overcomes the higher base of Billions.
When both run between 0 and +.5 z-score races, for example, Billions will win more often because of the higher
starting base.
The probability of running a +1 z-score or faster is
roughly 13.5%. It doesn’t happen as often, which is why Billions wins most of the races in a head-to-head.
However, once we introduce 10 clones of Y2k2k, about 80% of the time at least one of the 11 Y2k2ks will hit
the +1 or higher race, making it improbable for Billions to get a win unless it runs a crazy high speed.
This illustrates why predicting a given race outcome is incredibly complex without a simulator like ZSIM,
as you can imagine all the possible permutations that can occur when you have 12 different horses in the same race,
all with varying levels of base speed and variance. Everything is relative to the specific horses in a race,
but in general a high speed horse can be really profitable against good U horses.
But, as illustrated with Billions and Y2k2k,
as the number of U horses goes up, you run closer to that profitability threshold.
Speed Vs. Finish Positions
When analyzing a horse's past performance, two of the main data points to look at are finish position distributions (FPD) or finish times (which can be converted to speed figures, as ZSIM does). When you are looking at FPD, you are estimating a horse's chance of winning based on the rate it finished in those spots in the past. One of the reasons ZSIM prefers speed over FPD, is that FPD is highly contingent on the level of competition the horse ran against in the given race. Speed, however, measures how fast the horse can run, and this speed is true regardless of competition. For example, a division three collegiate sprinter may have an average finish position of 1.5 in all of its meets. Now, if there is another division one sprinter with the same average, using this metric results in a tie. However, if one used speed, you could gain more nuanced knowledge about the two sprinters' real ability and better predict the winner.
To illustrate this conundrum in the ZED data, we can set up two basic handicapping power ratings. For each race tested, a horse will receive a rank of 1-12, based on where it ranks in the given factor against the 11 other horses in the race. The power ratings are compound factors of a horse's ability and variance, the two driving factors in winning. However, one rating will use speed to determine ability and variance and the other will use FPD to determine ability and variance. The ratings are derived from all of the races a horse has run for a given distance, regardless of class or fee, and only horses with at least a 30 race sample are included. The chart below then groups the actual paid race results these horses had, broken out by their race rank.
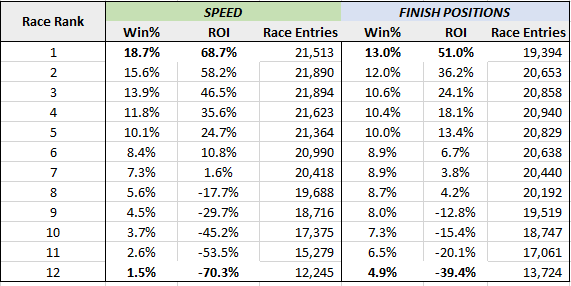
In reviewing of the above, the main takeaway is just how much more information is contained in the speed based factor than the FPD one. They both have very obvious signal in grouping the horses most likely to win, but the FPD factor doesn't have a great way to distinguish between horses that have similar finish position distributions (coming from different competition), so all of its predictions have less nuance and trend closer to the control average. Since there are 12 horses in a race, a person could pick the winner 8.3% of the time by doing nothing more than randomly picking a gate position (1/12 = 8.3%). So, in that light, the FPD factor picking 13% winners for rank 1 improved upon the control by 56%. But on the flip side, the speed based factor improved upon the control by 125%.
Similarly, take note of the 12th rank horse. Ideally, this horse should win the least. For speed, they only won 1.5% of the time, but FPD won at 4.9%, which is more than 3X worse than speed. Again, the primary reason for is that horses have a wide array of competition levels in their past performances, so it cannot adequately distinguish real ability from similar FPDs.
Conclusion
It's certainly true that the more selective you get with FPD, the better you can make it. Meaning, if today's race is a C1 paid race, your FPD accuracy will be improved if you only rank horses by their C1 paid FPD. However, this starts to detract from the sample size of the horse, significantly in some cases, creating other problems. Also, there's lots of complications based on seasonality. A horse may have a lot of history from October/November of 2021, but the type of horses in C1 paids today has drastically changed. In some cases, a horse that used to win at 20% may only be able to win at 10% today. Additionally, you may have horses that have run primarily in frees and want to dabble in paids, or there are horses that can down class easily, so a lot of their history is spread out over 2-3 classes.Paid vs. Free
One of the underlying assumptions of ZSIM's speed analysis is that you can predict how well you'll perform in paid races by using only free race data. However, this is related strictly to finish times, not your flame rate, win rate, ITM%, or anything related to actual finish postitions. For illustration, using the ZSIM speed figures (expressed in meters per minute), the chart below outlines a regression test that predicts how fast a horse will run in paid races using only its average free race finish times. The test required each horse to have at least a 30 race sample at 1200m in both paids and frees.
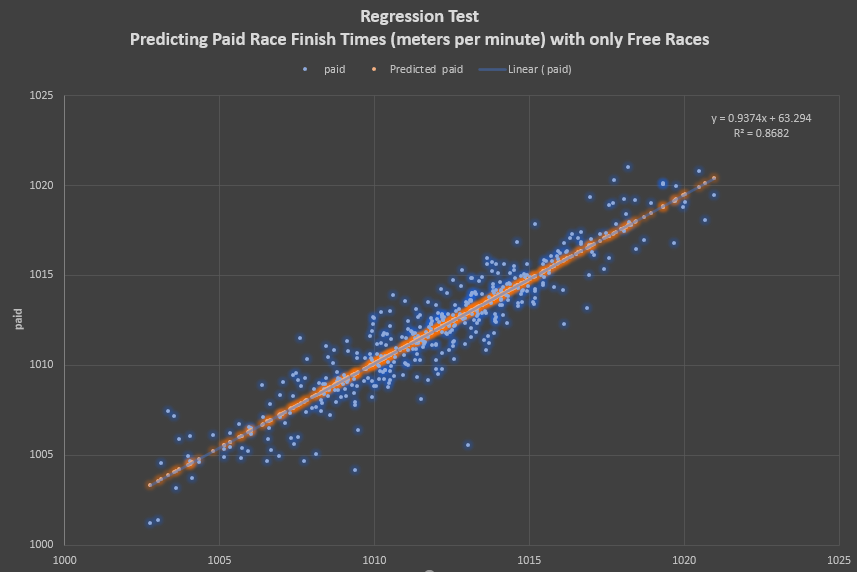
In some people's mind, there may be the opposite assumption - you run faster in frees and slower in paids, or there's just something that doesn't allow them to correlate. My thought is that this is a bit of confirmation bias caused by focusing on finish positions over times. And, as discussed above, the raw times can be misleading if you don't have a way to handle the Zed Variant. If you were to compare the average finish times of this sample, the paid race average is 1011.960 MPM and the free races just about match it at 1011.964 MPM. When studying other distances, nothing stands out as different, so I don't think there's an underlying algo difference when your horse runs in either fee category.
Predicting ZED Flames
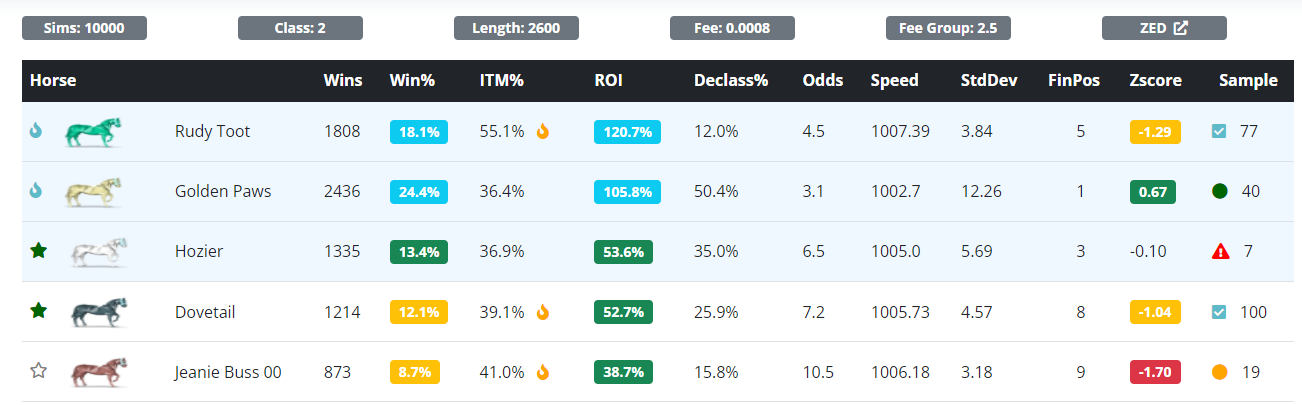
When running race simulations (before or after the race), you'll see orange flames next to a horse's ITM%, if they are ranked in the top 3. ZSIM blue flames will appear on horses that have a projected win rate of 17% or better, and it's not necessarily related to the ITM%. Since ZSIM ranks the horses by projected ROI, the top ITM horses may not always be the top ROI horses.
The example below illustrates this really well. ZSIM is saying that only one of the top three horses in the race, from an ROI perspective, is projected to receive ZED Flames. Also, keep in mind that ZSIM is not using historic flame rates for the race type to predict this (we don't use ZED Flames at all in our predictions), it's strictly using our simulator projections for ITM, which appears to be one of the primary criteria in ZED's flame algorithim.
When you look at the actual race on ZED, you can see ZSIM hit the nail on the head, especially with the disparity between ROI and ITM ranks.
The 2nd ranked ROI horse, with no ZED Flame, ends up winning. Further, it correctly predicted that the 1st, 4th, and 5th ranked ROI horses would be
the ones that ended up flamming on ZED.
How is this useful? It's not, necessarily, if you are only concerned about ROI ranks, but I do find it
anecdotally interesting to observe when ZSIM predictions and ZED flames align, which they often do, and even more when they don't.
There can be micro percentages
that separate two horses from receiving flames, based on ITM%, which can explain some discrepancy.
Additionally, it's often the case that when ZED Flames a horse that's not in the top 3 ITM%, it's one of the top 3 raw speed horses.

Another interesting facet about ZED flames, that you may note over time, is that it can be irrelevant with some horses. If there is a strong correlation between ITM rate and ZED awarding flames, but the high ITM horse isn't a top ROI horse, it's not necessarily better than a non-flaming horse. The most obvious examples of this are low ITM, high win%, U horses.
Predicting ZED Flames - Addendum Stats
Below are some additional hard stats about the exact frequency that the ZSIM predicted ITM horses (in the money, 1st-3rd place) align with ZED flames and why it may not ultimately matter.
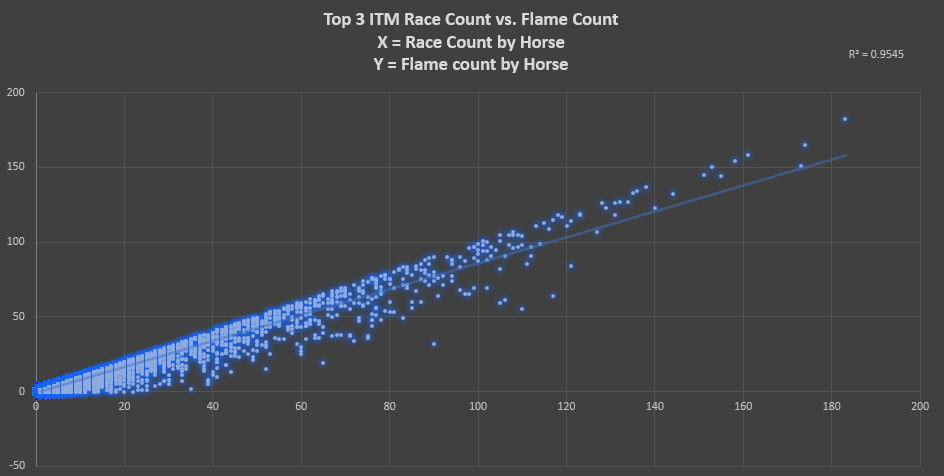
- ▪ The top three ITM% horses flame at a rate of 78%
- ▪ When the top three ITM% horses are also the top three in speed and ROI rank, they flame at a rate of 89%
- ▪ The number one ITM% horse flames at a rate of 93%
- ▪ When the number one ITM% horse is also number one in speed and ROI rank, it flames at a rate of 97%
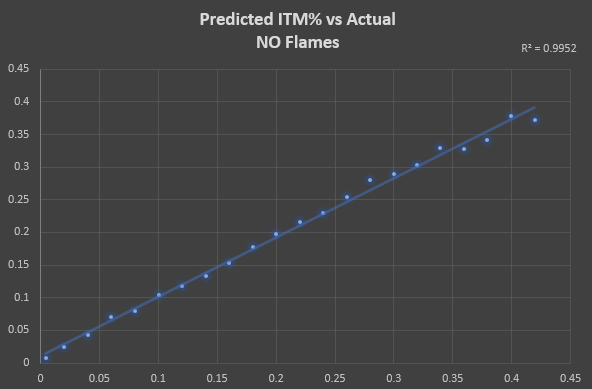
I mentioned originally that this is just an interesting facet, as the most important aspect is your ROI rank. Meaning, whether your horse ends up flaming isn't indicative of whether the ZSIM ROI projections hold over the long run. For instance, below shows the predicted performance from both ROI and ITM for horses that did NOT receive flames in their respective races from ZED. The chart groups horses by their pre-race ITM% prediction, rounded to the nearest .02 bucket.
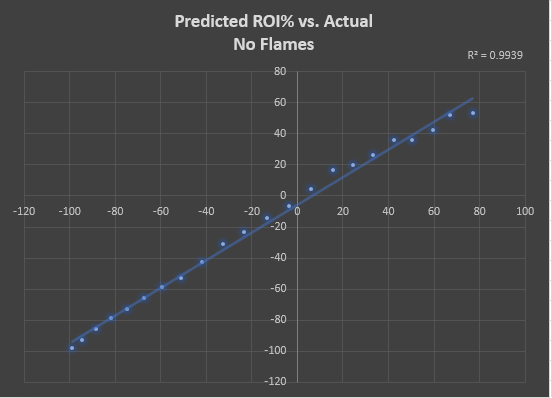
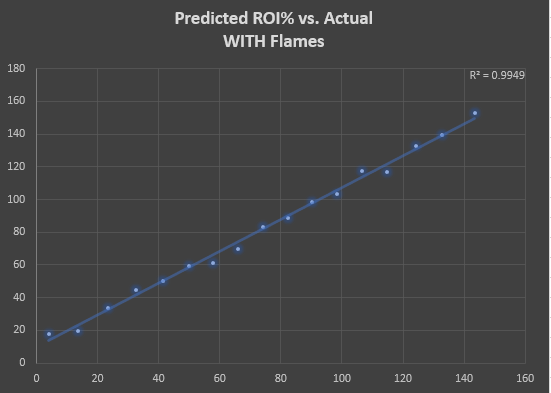
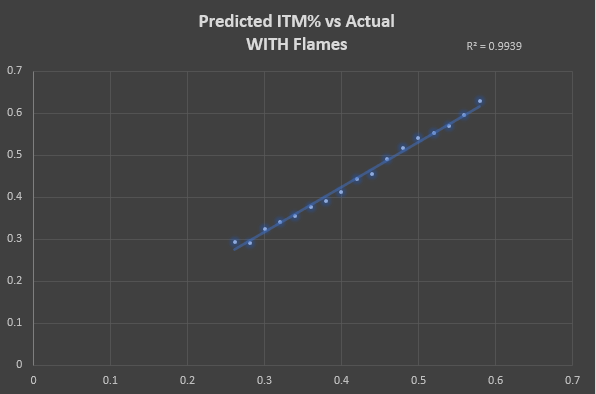
Below are the same charts, but this time it's only looking at horses that received flames. You can see that of the horses that ended up flaming, ZSIM never predicted an overall negative ROI or really low ITM rates. This makes sense, as horses that flame generally have a postivie ROI across the board and ZSIM's ITM/ROI projections are highly correlated with this.
*** These results were compiled from all paid races since 2/14/2022 and horses with a minimum 30 race sample.
ZED Flame Simulator vs. ZSIM
In the addendum stats above, I suggested that ZSIM’s ability to predict ZED flames may not matter. And it’s not just because there’s an acceptable margin of error to still turn a profit when ZSIM’s ITM% doesn’t align with the podium chances ZED suggests, represented by their flames. Rather, it’s because there are legitimate races and horses where ZSIM thinks a horse has a better ITM chance than represented by ZED’s flame simulator, and it often turns out correct.
To test this theory, I analyzed all the head-to-head combinations in paid races, since 1/1/2021. On one side of the head-to-head, you have the horse that ZED awards fire to. On the other side, you have a horse that did NOT get ZED flames, for the same race, but ZSIM thinks is actually better than or equal to the flaming horse.
| Head-to-Head Count | ZED Flamer | ZSIM Non-Flamer |
|---|---|---|
| 147,093 | 30.8% ITM | 30.94% ITM |
Above, you can see that in over 147,000 head-head-head race comparisons, the horse that received actual flames couldn't finish in the money more than the non-flaming ZSIM horse, if ZSIM thought that non-flamer had an equal or better chance to reach the podium. To expand the test, we can also look at what happens when ZSIM thinks the non-flamer has a >=5% higher chance of reaching the podium than the ZED Flamer.
| Head-to-Head Count | ZED Flamer | ZSIM Non-Flamer |
|---|---|---|
| 47,785 | 28.7% ITM | 32.1% ITM |
From this, you can see a very obvious gap occur between the ITM rate of the ZED flame horse and the ZSIM horse. As you continue to increase the advantage ZSIM says the non-flamer has, the more the gap grows in a fairly linear fashion.
Another interesting approach is to analyze it from the perspective of overall ROI predictions, where ZSIM takes into account first, second, and third place distributions more than just a raw ITM rate. Below is the exact same head-to-head type test, but now it's looking at non-flaming horses that ZSIM gives a better ROI prediction vs. their flaming counter part.
| Head-to-Head Count | ZED Flamer - Finishes Ahead | ZED Flamer - ROI | ZSIM Non-Flamer - Finishes Ahead | ZSIM Non-Flamer - ROI |
|---|---|---|---|---|
| 222,406 | 96,341 | 23.9% | 126,065 | 35.5% ROI |
Here, it's interesting to note the finishes ahead, where the ZSIM horse has a decided advantage of 126,065 over 96,341. Additionally, the horse that doesn't flame has an average ROI of 35.5% vs. a 23.9% ROI of the flaming horse. Conclusion? ZED flames are pretty accurate and they overlap with ZSIM the majority of the time. However, it's evident they have some noise that ZSIM can sniff out remarkably well, all things considered.
A Five Step Methodology for using ZSIM - Grading Your Horse
The main skill in ZED is one's ability to assess a horse's talent and predict where and how it can best perform. The common enemy in any approach is sample size, as there can be significant variance in outcome race to race. ZSIM provides at least five tools and concepts to help you in the handicapping process:
- Profiles/Simulations
- Funnel Metrics
- Speed Charting
- Flame Analysis
- Parent Analysis
To illustrate some of these concepts, I'll walk through a quick analysis of a horse. This is not a detailed breakdown of all the features and tools of ZSIM, but a methodology (perhaps one of many) on how you might use ZSIM effectively and avoid common pitfalls. Always do your own research.
Profile
When you load a horse, ZSIM will build a horse profile. This not only computes your speed and variance by distance and funnel, it runs simulations to show how these metrics would have performed against recent competition by fee, distance, and class level. However, you must understand that by default, ZSIM is interpreting your speed and variance "as is." Given how normal distributions work, your speed relative to sample size should always be close to and trend towards your long term average, but because of the volatility in the game in general, that's not always the case for pockets of races which creates some false positives. The simulator is the nucleus of all that ZSIM does, but to avoid getting burned on some of these outlier situations, you should go through the full grading process before making financial decisions.
Funnel Metrics
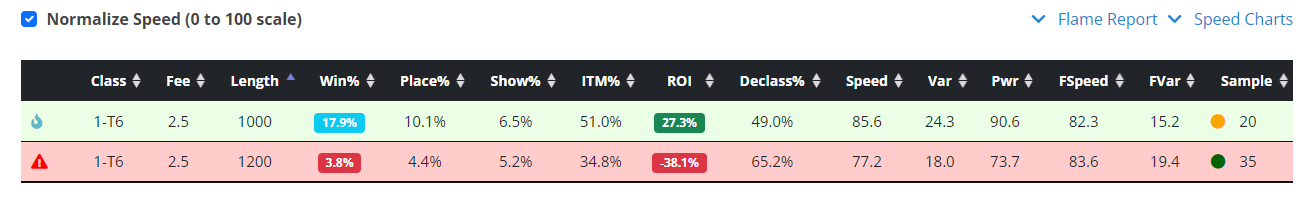
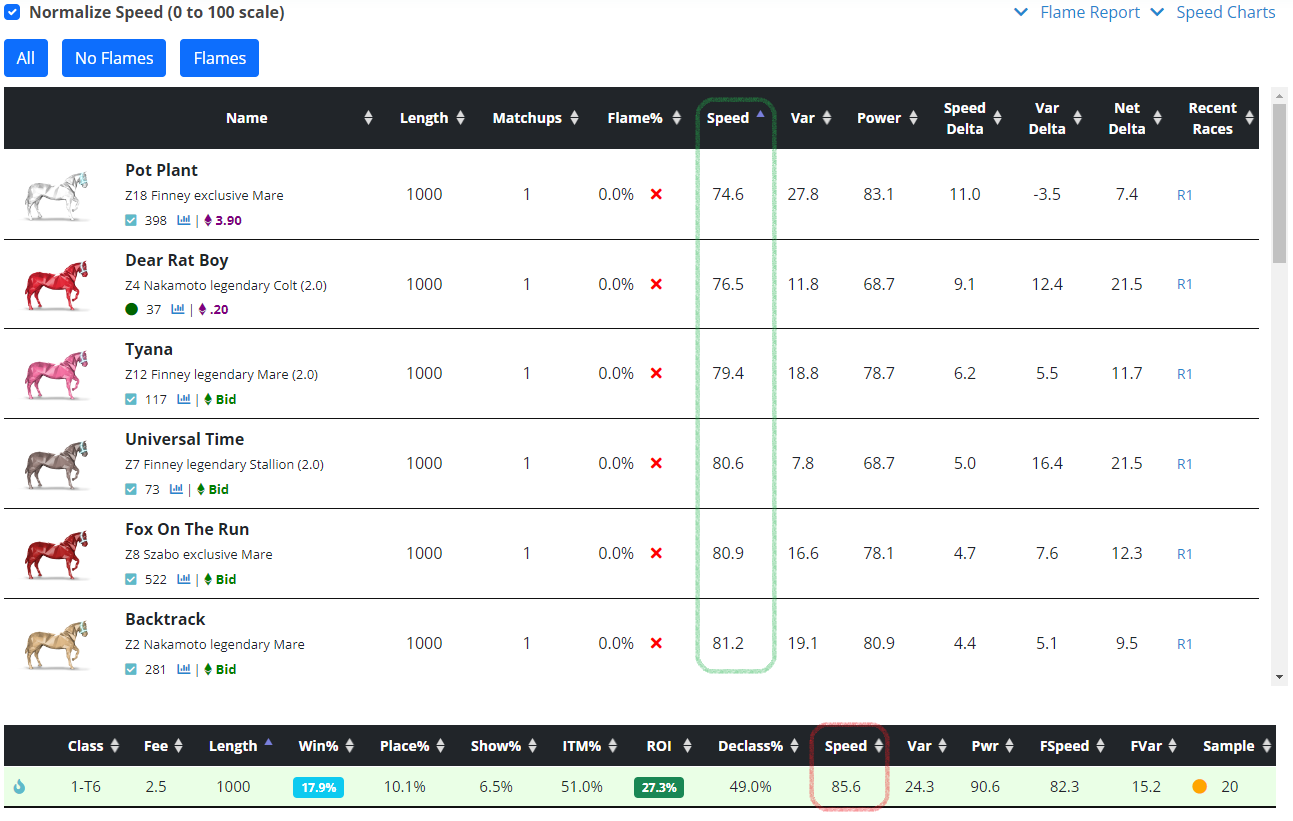
After building a profile, the first thing I check are the funnel metrics. In this step you are looking for large deviations between distances in the same funnel. In this situation, the 1000m speed is 85.6 while 1200m is 77.2. This is about an eight point gap, which is a large red flag. Generally, 70% of the time a horse will be within three normalized speed points at 1000m and 1200m (depending on DP). There's very few samples where a horse has a seven or more point gap over a large sample. So at a glance, either 1200m is going to come up or 1000m is going to go down, or some combination between the two.
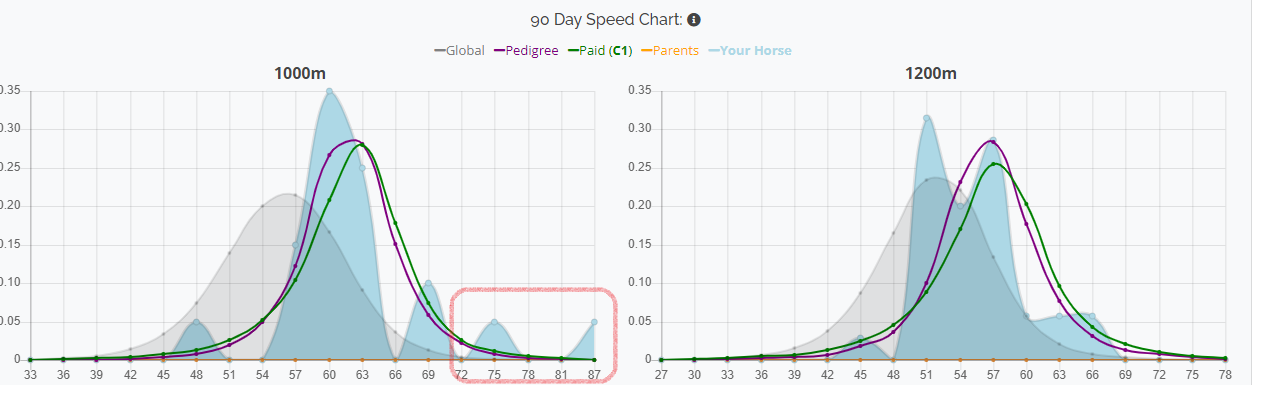
Speed Charting
An extension to the funnel metrics is speed charting. Here, you are looking for some visual anomalies and patterns that help you interpret the raw numbers shown in the profile.
Flame Analysis
Once reviewing the funnel speeds and charts, I'd move immediately into flame analysis. You may have limited data to go off of until you enter some stronger races, depending on your horse, and it's not a simple one to one correlation between who you flamed over or got flamed by and how fast you are. Regardless, it provides concrete direction, even if things are a little foggy. For this same horse, I clicked the Flame Report option in the profile and filtered to our suspect distance of 1000m and clicked the "No Flames" button. From there, I sorted speed ascending to see the slowest horses I got flamed by.
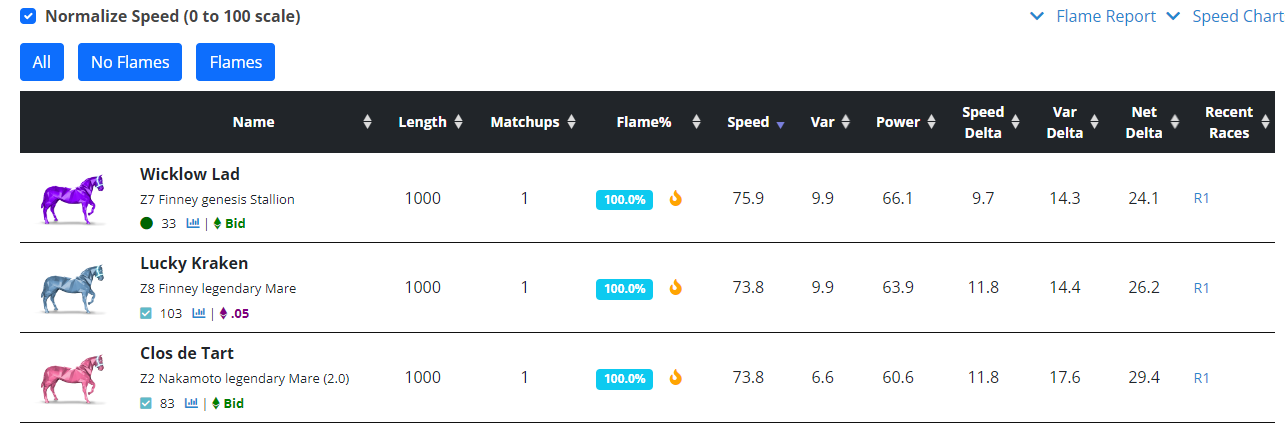
If you click the "Flames" button to see who this horse flamed over, you get confirmation from the other side:
Parent Analysis
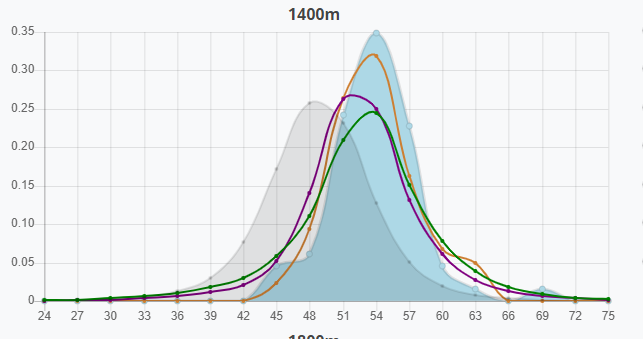
If you recall the speed chart for 1000m/12000m, you'll notice there is not an orange parent line on it, since there was not sufficient sample. However, the 1400m distance does have this, which is indicative that the horse should be strongest at 1400, assuming a 2.0 breed and the parents built a sample around their strongest distance as well (usually the case).
However, to illustrate parental analysis another way, here's a different horse which has multiple samples to work with:
Summary
Goal: winning C1 paids at 1000m
Grade:
- Does the profile say I can win where I want to race: A (5)
- Do the funnel metrics align: F (1)
- Do the speed charts contain anomalies for the sample: F (1)
- Do the flames align: F (1)
- Is the speed consistent with Parents: F (1)
The actual grades/numbers you use, and how you weight them, is somewhat subjective, but this should give you a framework for how to think about horses holistically. Granted, the example chosen here was a cherry picked outlier situation, many horses will naturally fall in line, but you'll definitely come across these on smaller samples (and even some larger ones). And of course, if you check out the sample size section of the docs, it's evident that 20 races by itself can leave room for a lot of caution (without doing any of this analysis). Most horses self correct as they approach 50-100 races, sometimes longer, depending on variance and how extreme the situation is.
One of the features of the ZSIM simulator is to use funnel metrics, which does help control for some of these outlier situations. For instance, like the example above, if a horse has 1000m speeds much faster than 1200m, ZSIM will normalize and weight the speeds together, correcting for a lot of the 1000m overage. Why not just use funnel simulations all the time? You certainly can, and it performs better in certain contexts. It's just a trade off either way, so something to be aware of. The most predictive metric for a particular distance is that distance itself. Whenever you merge and normalize, you lose a little information, but it's worth it for small samples that run the risk of being abnormally skewed.
In conclusion, this five step methodolgy will start to happen organically as you glance through the available data. With time and study, you naturally start to build an instinct and feel for what a horse will do based on what you can see today. It's never perfect, of course, as there's a necessary component of the unknown in this game, which makes it what it is.
Horse Analysis - Expected Value
Even when something is a “game of skill,” if there are random variables determining the outcome, one is usually not going to experience the game in a linear consistent path. It’s going to consist of wild downswings, long periods of average results, the heaters that make one feel invincible, or any other combination of these. This is where the concept of expected value (EV) comes in, providing an anchor between the extremes of how the game is experienced in real time, with real wins and losses, and how it should work in theory.
When analyzing events through the lens of EV, a player is not concerned with whether they made a decision that led to a losing result. They are concerned about whether they made a decision that had a positive EV before the result was known. In traditional pari-mutuel thoroughbred horse racing, this would be betting on horses that are an overlay, where the horse has a better chance of winning the race than their odds dictate. In poker, you might reference it as pot odds, where the ratio between the price to call and the value of the pot is analyzed against the probability that you make your hand. Since ZED Run doesn’t have a pari-mutuel element to it, the concept of an overlay is flavored a bit differently, but it is still very similar. By paying an entry fee, you are essentially betting on the fact that your horse can win enough to be an overlay within a fixed odds system. This analysis is one of the main purposes of the race simulator, as it provides these exact EV numbers in terms of predicted ROI.
There’s also a higher-level EV analysis that begins before you ever enter a race, and that’s the cost to buy a horse relative to what it could return in the ZED racing environment (I’m leaving other forms of revenue from breeding out of this, for simplicity). This is where the ZSIM profile report helps, as it provides EV numbers for every class, distance, and fee level. You can see immediately if the horse can beat $5.0 races, or only $2.5 races, and if the horse can even win at its current class; and if it cannot, the likelihood that it can declass to a level with a positive EV. But, even if you have a winner on paper, there's more things you could consider.
Standard Error
To help understand how you might calculate EV more in depth, it helps to learn about standard error (SE). Using ZSIM figures, you may see a horse that has a 1050 speed rating, 5 speed standard deviation (SD), with a 50-race sample. SE helps you understand the degree to which that value may end up being slower or faster in the long run. To calculate SE, you’d do the following for a 95% confidence interval:
- ▪ Standard deviation (SD) divided by the square root of your sample size multiplied by 1.96: SD / SQRT(SAMPLE) * 1.96
- ▪ Using our example horse, this would be: 5 / 8.66 * 1.96 = 1.36 SE
Based on the SE calcualtions above, you can be 95% confident that your speed of 1050 is accurate to the degree of +/- 1.36 speed, which means it could fall somewhere between 1048.64 and 1051.36 in the long run (say after 1,000 races). Additionally, using the SE formula you can see the impact that your SD and sample size have in your potential error range. For instance:
- ▪ If our sample size was 25 (square root = 5), then it would be: 5 / 5 * 1.96 = 1.96 SE. That's about a 144% increase in error range from the former 1.36 at 50 race sample.
- ▪ If our sample size was 500 (square root = 22.36), then it would be: 5 / 22.36 * 1.96 = .44 SE. That's a 68% reduction in the potential error range over the 50 race sample.
- ▪ If the horse had an SD of 10, then it would be: 10 / 8.66 * 1.96 = 2.26 SE. This is a 166% increase in potential error over a horse with 5 SD.
So obviously, the larger your sample the less impact the SE will have in your EV calucations. Additionally, the larger your SD (despite that this can be a good thing), the more likely it will be you will have to factor in a wider range of SE. Next, we'll outline a simplistic way to interpret a horse's SE relative to an EV model, whatever it may be.
Cost Based Analysis
Imagine that your profile says you have a positive EV (ROI) projection for your current mean speed of 1050 (based on the original example above). However, taking your SE into account, the more the horse trends towards the lower end of 1048.64, the more your projected ROI would decrease. And of course, if you trend all the way to 1048.64, maybe it’s not possible to win at all. Say you are considering buying our example horse at .5 ETH ($1,500 USD), and it’s projected to beat C1 2.50s at 40% ROI. If you can manage 9 races a day you should profit $1.00 per race, or $9.00 a day. This means it would take close to six months to break even on the purchase. However, there’s also a 50% chance your horse underperforms to some degree, per the SE, so you may make much less or nothing at all.
For simplicity, let’s only consider two options: it either breaks even at 0% ROI (you hit the extreme negative roll of SE); or, it makes the expected 40% ROI (it hits the positive roll of the SE). With these options, after six months there’s a 50% chance you have made 0 profit and now own a $1,500 horse which may only be worth $750, since you just proved over six months the best it can do is break even in C1 2.50s. This is another way of saying that if you buy this horse, you have a 50% chance of losing $750. But, if the horse maintains or trends up, you stand to profit $1,500 from racing revenue; and, since it’s a winner, let’s assume the horse maintains its value so you could get your original purchase price back out.
To summarize then, 50% of the time you are going to lose $750 and 50% of the time you are going to profit $1,500. Your EV is then calculated by taking the $750 risk divided by the potential profit of $1,500, which gives you a +50% EV. If this same horse happened to cost 1 eth (or $3,000 USD), you can see how that would change the EV of the investment dramatically. If you paid $3,000, your potential loss is $1,500, while your potential profit remains at $1,500, making it a 0% EV purchase. One could add additional variables or debate their probabilities and impact. But, regardless of what EV model you come up with, if you judge two different horses or price points by the same model, you can get a relative comparison between them.
Conclusion
There are many other factors you could and should consider, especially the more catastrophic ones, like the probability that ZED Run folds up shop entirely and all NFT horses go to zero, that the ZED meta changes enough to where this horse’s ability to win goes down, regardless of how you trend speed wise, the future value of ETH, etc. Some of this may be impossible to predict on a pragmatic scale, but at the least, one should be doing some type of high-level EV evaluations, like the speed/SE analysis outlined above and develop risk thresholds. For instance, even if a purchase has a +50% EV like the one above, that’s only if you survive the ZED meta for six months of racing. Maybe you should only be accepting propositions where it’s 50% over three months, increasing your chances of avoiding some of the harder to predict variables of ZED Run.
Technical Details
- ZSIM only uses horse race data since 9/1/2021, so your sample sizes for a particular length may be smaller on ZSIM than your actual.
- The race results feed refreshes approximately every five minutes. This means you should be able to find a race in the Simulator tool, and see your new class level (if applicable), within five minutes of a race finishing.
- Horse profiles can be refreshed up to multiple times per day, depending on horse activity, when you load the profile. Profiles are built by simulating races that have run in the last 14 days. Because of this, your profile will adjust to the current competition level, based on a rolling 14 day average.
- Other computational heavy tasks, such as recomputing speed times, standard deviation, and z-scores, occurs every 20 minutes.
- For open races, you can refresh your report every 20 seconds.