Note: new Speed and DP numbers are currently under development. The recent update has brought significant changes and horses will need to be rediscovered for racing 3.0. Use caution in the interim.
Pre-Race Simulation
Perform a 10,000 run simulation of any race to know your expected win rate, ROI, and the likelihood that you will flame, all before it runs or the race registration closes. Choose the most profitable race to enter, or avoid the race entirely. Check out a race simulation report and more details here
Automate your Profits
ZSIM will import all open races from ZED RUN and tell you the exact race IDs to enter based on your projected ROI. You'll also be given a deep link to the ZED Run site for the specific race, simplifying the registration process. Check out how accurate the ZSIM predictions are here.
Avoid Donkeys
A ZSIM Profile is like a CARFAX for your ZED Run NFT-based digital horse. ZSIM runs hundreds of thousands of simulations to generate a horse profile containing expected win rates and ROI at every class, distance, and fee level. Take the guess work out of your analysis without risking money. See more.
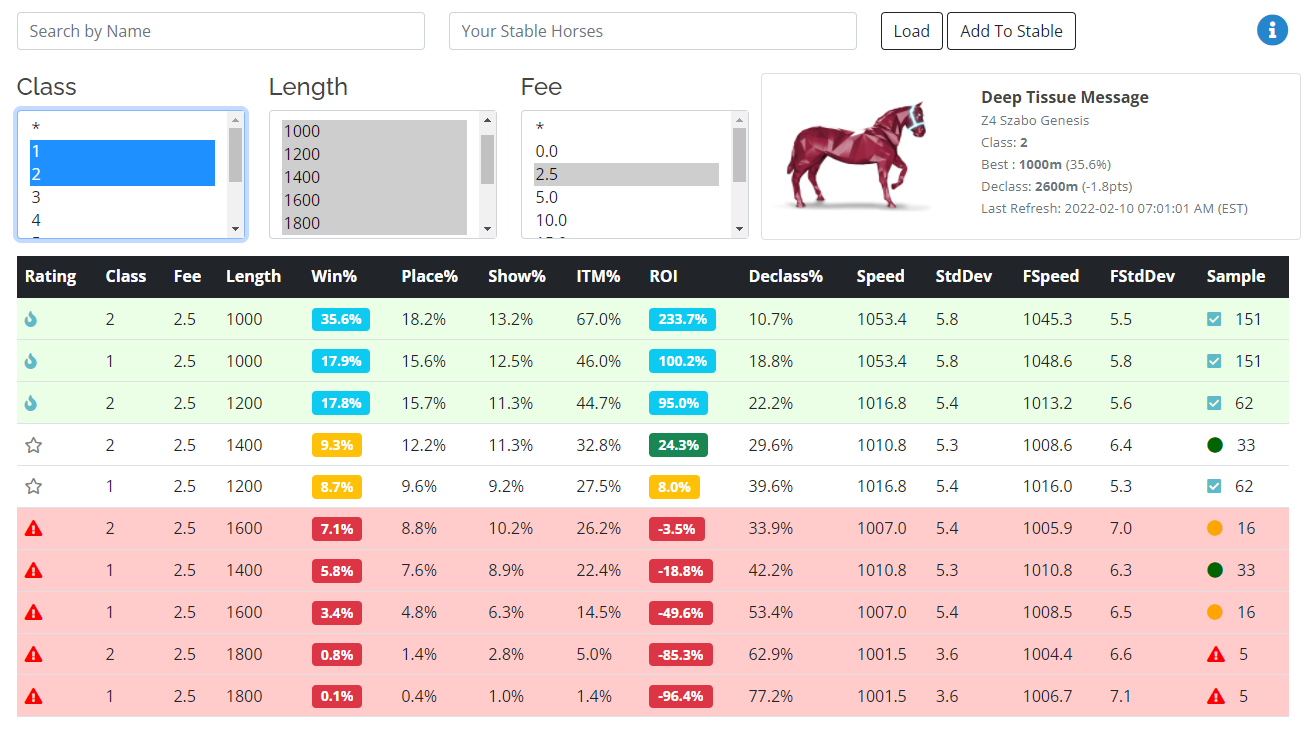
Horse Profiler
ZSIM performs hundreds of thousands of simulations against all class, fee, and distance combinations to predict where a horse can best compete. These simulation results are compiled into a profile report, enabling you to assess the horse at a glance.
- Know your expected win percentage and ROI at any level of competition
- Using the simulated class points per race, develop easy to follow declassing strategies
- Allow ZSIM to handle all data transformation, as it automatically adjusts the profile for a recency bias in field strength
- Gain early insights with how your horse's speed and deviation compares to all other horses within the class/length/fee group
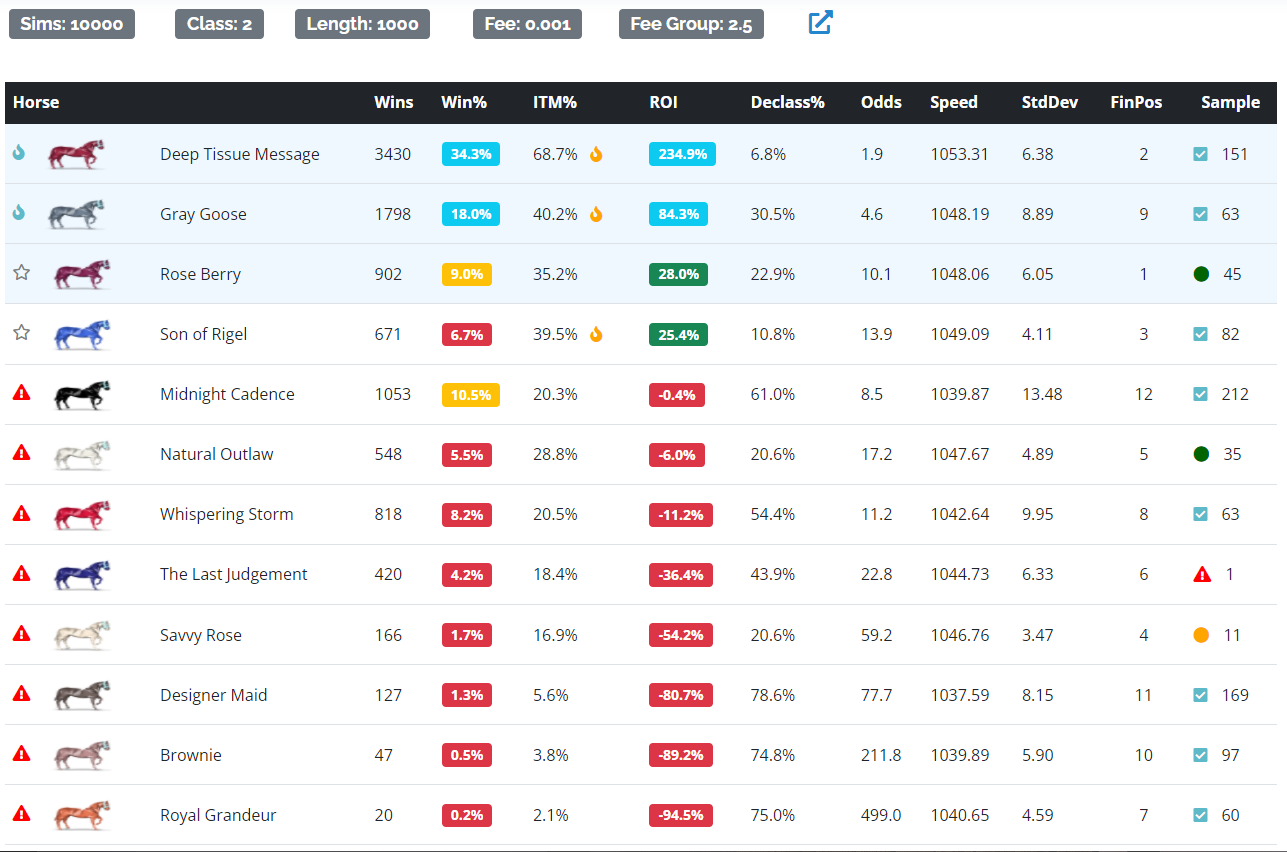
Match Up Simulator
ZSIM also allows you to zero in on individual races. These can be actual ZED Run races or match ups you design with digtal horses of your choosing. For each matchup, ZSIM will run a 10,000 race simulation.
- Better understand a race's unique context with a more granular horse vs. horse analysis
- Does the top of the field have similar win rates? Or, are there horses with large 5-10% advantages over the rest of the field?
- Are you entering races where your predicted win rate is under 8%, or even worse, 2.5%??
- Predict your in the money or declassing percentage rate (finishing 8th-12th)
- Want to know how three horses would fair against each other at 1200m? Throw them into a custom matchup simulation and see
Simulation vs. Reality
Focusing on actual win/loss records and raw finish times can provide limited data and leave an incomplete picture.
It's also a challenge to adjust for race field strength, especially from a win/loss perspective, and then extrapolate it's application to other class and fee levels
without taking undue risk.
Although ZSIM relies on actual race and horse data, it can use various horse attributes and data from free or paid races to create a surprisingly accurate model.
The chart to the left outlines the model's predictive power. In a recent sampling of over 600,000 race entries, the ZSIM model gave each horse
a predicted win%. When rounded to the nearest whole percent, you can see how horses in that particular group faired in reality.
For example, there were
46,230 horses with a ZSIM predicted win rate of 5% (4.50% to 5.49% rounded to 5%). The horses that fell into the 5% bucket had an actual win rate of 4.9%.
This test was performed against paid races at all fee and class levels.